Volatility is a term often heard in financial circles, commonly used to describe the unpredictable nature of markets. It’s the degree of variation in the trading price series of a financial asset over time. While it might sound intimidating, volatility is an integral aspect of financial markets, influencing investment decisions, risk management strategies, and market behaviors. In this article, we delve deep into the concept of volatility, exploring its causes, measurements, implications, and strategies for navigating through volatile market conditions.
Definition of Volatility
Volatility is a statistical measure of the dispersion of returns for a given security or market index. It quantifies the degree of variation of a trading price series over time. In simpler terms, it reflects how much the price of an asset deviates from its average value. High volatility implies larger price swings, indicating greater uncertainty and risk, while low volatility suggests stability and predictability.

Causes
- Economic Factors: Economic indicators such as GDP growth, inflation, interest rates, and employment figures play a significant role in driving market volatility. Changes in these macroeconomic variables can influence investor sentiment and asset prices.
- Geopolitical Events: Political instability, wars, trade disputes, and geopolitical tensions can trigger market volatility by introducing uncertainty about future economic conditions and corporate performance.
- Corporate Earnings: Quarterly earnings reports and guidance from publicly traded companies can have a substantial impact on market volatility. Positive or negative surprises in earnings often lead to significant price movements.
- Market Sentiment: Investor psychology and market sentiment can exacerbate volatility. Fear, greed, and herd behavior can cause rapid shifts in market direction, leading to exaggerated price fluctuations.
Measurement of Volatility
Volatility is commonly measured using statistical tools such as standard deviation, variance, and the more sophisticated concept of implied volatility derived from option pricing models. Standard deviation quantifies the dispersion of returns around the mean, providing a historical perspective on volatility. Variance, the square of standard deviation, offers a measure of the average squared deviation from the mean. Implied volatility, on the other hand, reflects market participants’ expectations of future volatility, inferred from the prices of options contracts. This technique is used in the CBOE Volatility Index (VIX).
The CBOE Volatility Index (VIX)
The CBOE Volatility Index, commonly known as the VIX, is a widely followed measure of market volatility and investor sentiment in the U.S. stock market. Created by the Chicago Board Options Exchange (CBOE) in 1993, the VIX is often referred to as the “fear gauge” or “fear index” due to its ability to gauge investor fear or complacency.
The VIX is calculated using the prices of options on the S&P 500 Index, one of the most widely followed benchmarks of the U.S. equity market. Specifically, the VIX is derived from the implied volatility of a specific set of S&P 500 options with near-term expirations. Implied volatility reflects market participants’ expectations of future volatility based on the prices of options contracts.

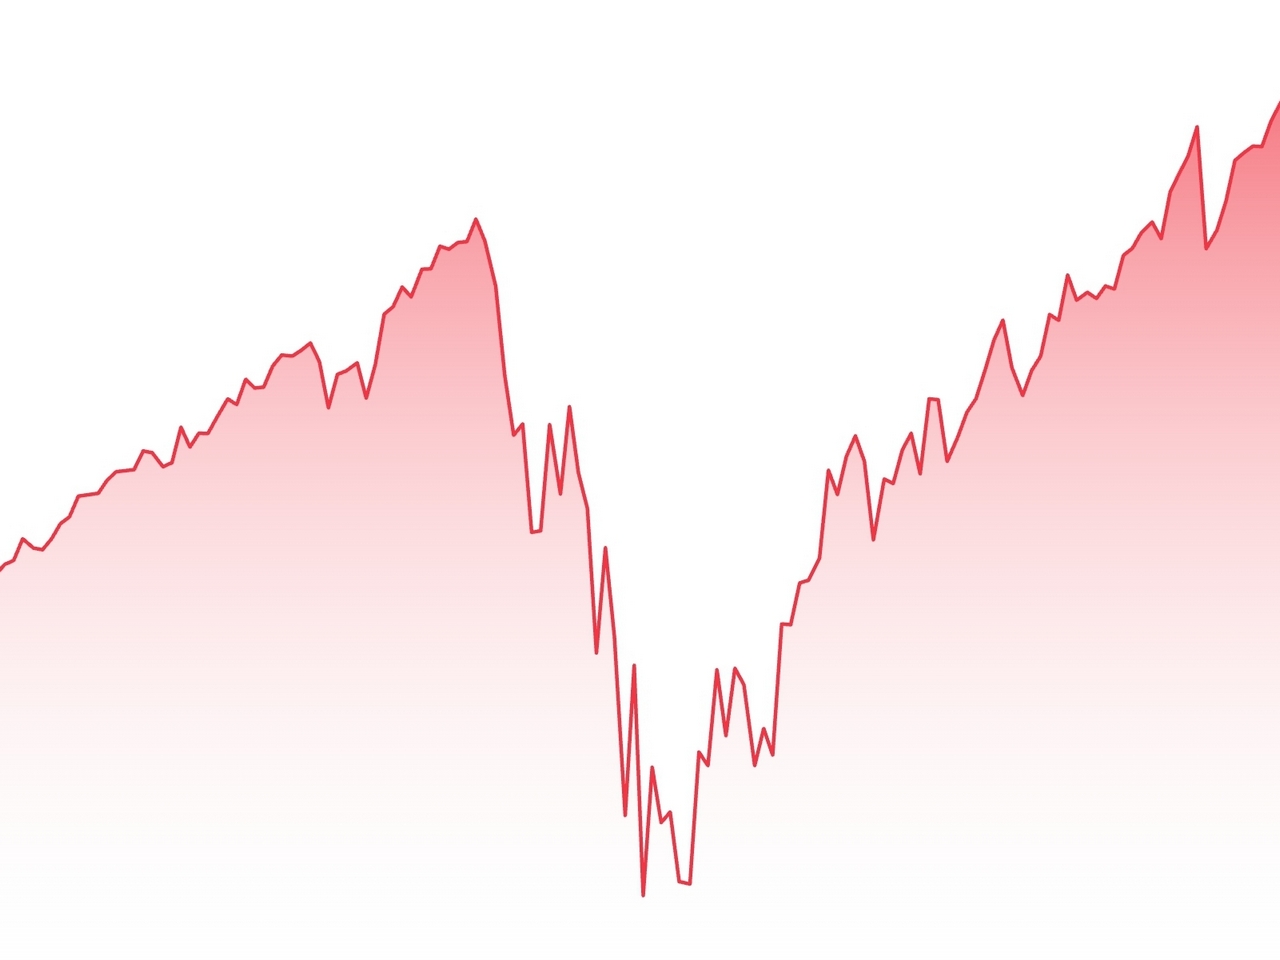
VIX index 1990-2024/TradingView
The VIX is calculated using a formula that weighs different S&P 500 options prices to estimate the expected volatility of the index over the next 30 days. Higher VIX values indicate higher expected volatility, reflecting increased uncertainty or fear among investors, while lower VIX values suggest lower expected volatility and greater market complacency.
The VIX is often used by traders, investors, and portfolio managers as a tool for risk management, hedging, and tactical asset allocation. A rising VIX may signal a potential increase in market turbulence and downside risk, prompting investors to hedge their portfolios or reduce exposure to riskier assets. Conversely, a falling VIX may indicate improving investor sentiment and a more favorable risk environment, encouraging investors to increase their exposure to equities or risk assets.
In addition to its role as a measure of market volatility, the VIX has also become a widely traded financial instrument. Investors can trade VIX futures, options, and exchange-traded products (ETPs) that track the VIX, allowing them to directly speculate on changes in market volatility or hedge against volatility risk in their portfolios.
Beta
Beta measures the relative volatility of a particular stock compared to the overall market, typically the S&P 500 index. Stocks with higher betas are generally more volatile, meaning their prices tend to fluctuate more significantly in response to market movements. Conversely, stocks with lower betas are typically less volatile and exhibit more stable price movements relative to the market.
The beta coefficient is calculated using regression analysis, where historical returns of the stock are regressed against the returns of the market index over a specified period. The resulting beta value indicates the stock’s volatility relative to the market:
- A beta greater than 1 indicates that the stock tends to be more volatile than the market. For example, if a stock has a beta of 1.2, it is expected to move 20% more than the market for every 1% move in the market.
- A beta less than 1 suggests that the stock is less volatile than the market. For instance, if a stock has a beta of 0.8, it is expected to move 20% less than the market for every 1% move in the market.
- A beta equal to 1 indicates that the stock moves in line with the market. If the market goes up 1%, the stock is expected to go up by the same percentage.
Investors use beta as a tool for assessing risk and constructing diversified portfolios. Stocks with higher betas are considered riskier investments because they have a greater potential for price fluctuations, while stocks with lower betas are seen as safer investments due to their relative stability. By incorporating stocks with different beta values into their portfolios, investors can manage risk exposure and potentially enhance risk-adjusted returns.

Free Backtesting Spreadsheet
Types of Volatility
Volatility can be categorized into several types, each representing different aspects of market dynamics, ranging from historical price movements to market expectations and conditional behavior.
Historical Volatility
Historical volatility, also known as statistical volatility, measures the variability of an asset’s price over a specific historical period. It is typically calculated using standard deviation or variance of past returns. Historical volatility provides insights into the past behavior of an asset and helps traders and investors gauge its price fluctuations over time.
Implied Volatility
Implied volatility represents market participants’ expectations of future volatility implied by the prices of options contracts. It is derived from option pricing models, such as the Black-Scholes model, and reflects the market’s consensus on the potential magnitude of future price movements. Implied volatility is a key input in option pricing and trading strategies, as it affects the premiums of options contracts: higher implied volatility leads to higher premiums, while lower implied volatility leads to lower premiums.
Realized Volatility
Realized volatility measures the actual volatility experienced by an asset over a specific period, often referred to as historical realized volatility. Unlike implied volatility, which is based on market expectations, realized volatility is calculated using observed price data. Realized volatility provides a retrospective view of how much an asset’s price has fluctuated in the past, offering insights into its actual volatility dynamics. For example, if realized volatility for a stock over the past month is calculated to be 20%, it means that, on average, the stock’s price has fluctuated by 20% from one trading day to the next over that month.
Conditional Volatility
Conditional volatility, also known as time-varying volatility, refers to volatility that changes over time based on certain conditions or factors. This type of volatility acknowledges that volatility levels may vary under different market conditions, economic environments, or stages of the market cycle. For example, during periods of economic uncertainty or geopolitical instability, investors may become more cautious, leading to increased market volatility. Conversely, during periods of economic growth and stability, volatility levels may decrease as investor confidence rises. Models such as GARCH (Generalized Autoregressive Conditional Heteroskedasticity) are used to capture the conditional nature of volatility.
Seasonal Volatility
Seasonal volatility refers to fluctuations in asset prices or market volatility that occur periodically at certain times of the year or during specific seasons. Seasonal patterns may arise due to recurring events, economic cycles, or behavioral factors that influence market participants’ behavior. Identifying and understanding seasonal volatility patterns can help traders and investors anticipate price movements and adjust their strategies accordingly.
Cross-Sectional Volatility
Cross-sectional volatility compares the volatility of different assets within the same market or asset class at a specific point in time. It measures the dispersion of returns among individual assets relative to each other. Cross-sectional volatility provides insights into the relative riskiness of different assets and can be used in portfolio construction, asset allocation, and risk management decisions.
Impact of Volatility
- Investment Risk: Volatility represents uncertainty and risk for investors. Higher volatility implies greater potential for price fluctuations, leading to higher investment risk. Risk-averse investors may seek assets with lower volatility to preserve capital, while risk-tolerant investors may embrace volatility as an opportunity for higher returns.
- Trading Opportunities: Volatility creates trading opportunities for active traders and speculators. Price movements driven by volatility can generate profits through buying low and selling high or short-selling high and buying low in a declining market.
- Portfolio Diversification: Volatility plays a crucial role in portfolio diversification. Assets with low or negative correlations can help mitigate overall portfolio volatility by offsetting losses in one asset class with gains in another.
- Option Pricing: Volatility is a key determinant of option prices. Higher volatility increases the likelihood of large price movements, resulting in higher option premiums. Option traders use volatility forecasts to assess the attractiveness of option strategies and adjust their positions accordingly.
Maintaining a long-term perspective and avoiding emotional reactions to market fluctuations can help investors ride out volatility and achieve their investment objectives.
Navigating Volatile Markets
Navigating through volatile markets requires a combination of careful analysis, risk management, and discipline. Diversification is key to managing volatility risk, as spreading investments across different asset classes and geographic regions can help reduce portfolio volatility. Employing hedging strategies such as options and futures contracts can also protect against downside risk during volatile periods.
Moreover, maintaining a long-term perspective and avoiding emotional reactions to market fluctuations can help investors ride out volatility and achieve their investment objectives. By recognizing and mitigating the impact of behavioral biases on decision-making, investors can make more informed and rational investment choices, reduce the likelihood of succumbing to herd behavior or emotional reactions, and better manage volatility-induced risks.
Strategies for Volatility Trading
For traders seeking to capitalize on volatility, a range of strategies exists to manage risk and potentially profit from short-term price movements.
- Volatility Trading: Volatility trading strategies involve actively trading financial instruments sensitive to changes in volatility levels. Options, VIX futures, and exchange-traded funds (ETFs) tracking volatility are common instruments in this approach. Traders may take advantage of fluctuations in implied and realized volatility to execute strategies such as long straddles, long strangles, volatility spreads, and gamma scalping. By carefully monitoring volatility levels and option prices, traders can profit from volatility shifts.
- Mean-Reversion Trading: Mean-reversion trading aims to identify periods of high volatility and speculate on a return to normal levels. Traders employing this strategy anticipate that extreme movements will eventually revert to the mean. By entering positions when volatility is excessively high and exiting when it normalizes, traders seek to profit from the reversion of prices to their average levels.
- Momentum Trading: Momentum trading strategies focus on capitalizing on trends in asset prices during periods of high volatility. Regardless of market conditions, momentum traders aim to ride the trend as long as it persists, entering positions in assets exhibiting upward momentum and exiting before the trend reverses. By following price momentum, traders seek to capture profits from short-term price movements driven by volatility.
- Hedging: Hedging strategies involve using derivatives such as options, futures, and swaps to protect against adverse price movements. Investors hedge their portfolios against volatility risk by taking offsetting positions that profit from price movements in the opposite direction. By hedging against potential losses, investors can safeguard their portfolios during periods of heightened volatility.
Final Thoughts
Volatility is an inherent characteristic of financial markets, reflecting the dynamic interplay of supply and demand forces, economic fundamentals, and investor sentiment. While volatility presents challenges and risks for investors, it also offers opportunities for profit and portfolio diversification. By understanding the causes, measurement, impact, and strategies to navigate volatility, investors can better manage risk and capitalize on market dynamics to achieve their financial objectives.
Share on Social Media:


