In the ever-evolving realm of stock market dynamics, exchange-traded funds (ETFs) have risen as potent tools, offering investors diversified access to specific sectors, regions, or investment themes. Among this expansive array of ETF options, the Invesco QQQ Trust (NASDAQ: QQQ) shines as a pivotal conduit to the tech-centric Nasdaq-100 Index. Renowned for its emphasis on innovative, growth-oriented companies, the QQQ ETF commands attention from both seasoned traders and savvy investors. This article embarks on an in-depth exploration of QQQ ETF trading intricacies, delving into its underlying index, historical performance, constituent components, trading methodologies, and risk assessments.
Understanding the QQQ ETF
The QQQ ETF, launched in 1999 by Invesco, tracks the Nasdaq-100 Index, which comprises the 100 largest non-financial companies listed on the Nasdaq Stock Market. Notably, the index is heavily skewed towards the technology sector, with prominent holdings including tech giants such as Apple, Microsoft, Amazon, and Alphabet (Google). Additionally, the index encompasses companies from other sectors like consumer discretionary, healthcare, and communication services, albeit with a significant emphasis on technology and innovation.
Historical Performance and Growth
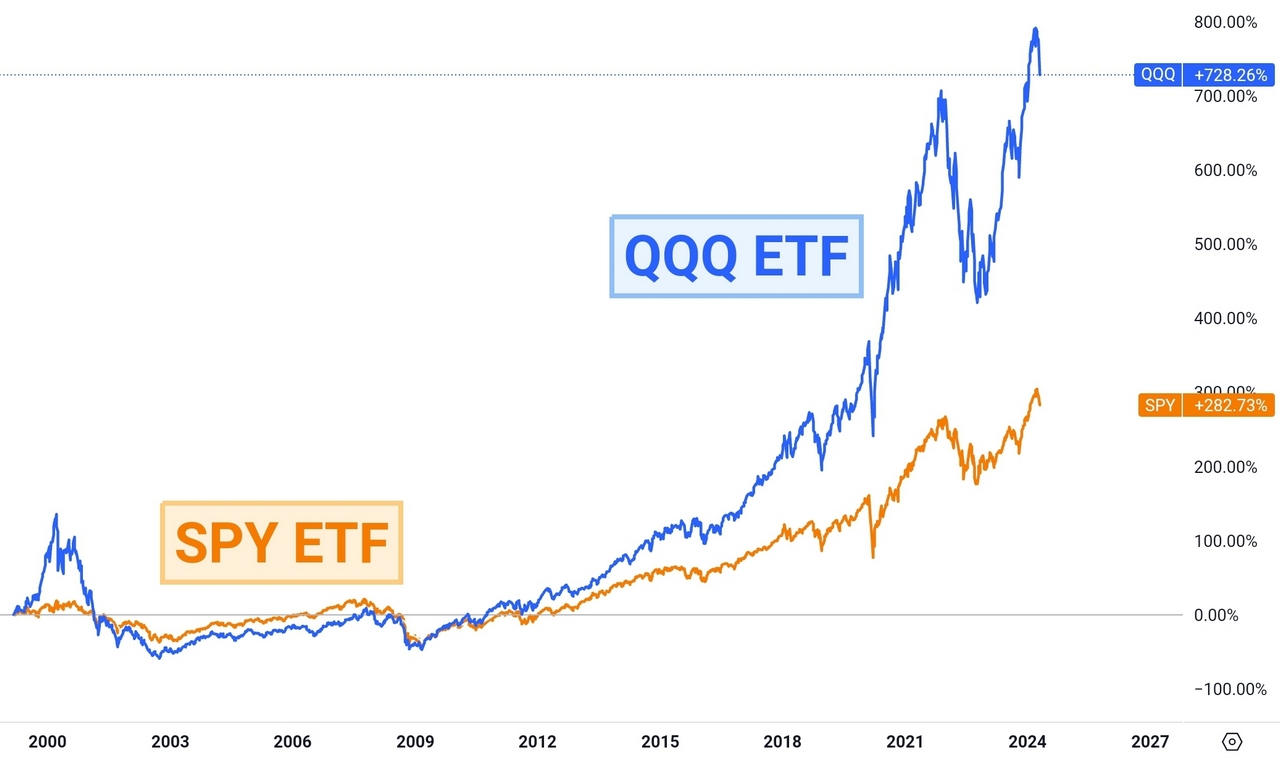
The QQQ ETF historical performance (1999-2024) in comparison to the SPY ETF
Over the years, the QQQ ETF has delivered remarkable performance, fueled by the robust growth of its underlying constituents. The tech-centric nature of the Nasdaq-100 index has been a major catalyst, especially during periods of technological innovation and digital transformation. For instance, the surge in demand for technology products and services amid the COVID-19 pandemic further propelled the performance of QQQ, as remote work, e-commerce, and digitalization trends accelerated.
Despite occasional setbacks and volatility, the long-term trajectory of the QQQ ETF has been characterized by consistent growth, outperforming broader market indices like the S&P 500 in many instances. This outperformance can be attributed to the innovative prowess and global dominance of the companies within the Nasdaq-100 index, which continually push the boundaries of technology and drive shareholder value.
Key Components of QQQ ETF and Sector Allocation
A crucial aspect of trading the QQQ ETF is understanding its key components and sector allocation. As of 4/17/2024, the top holdings of QQQ include tech behemoths like Microsoft, Apple, Amazon, Alphabet and Nvidia which collectively exert a significant influence on the ETF’s performance. Moreover, investors should pay close attention to the sector allocation within QQQ, given its pronounced tilt towards technology stocks. While this sector concentration enhances the ETF’s potential for capitalizing on tech-driven growth trends, it also exposes investors to sector-specific risks and market fluctuations.
TOP20 Holdings of QQQ ETF
The holdings of the QQQ ETF change over time due to fluctuations in stock prices and portfolio rebalancing. As of 4/17/2024, the top holdings of QQQ includes some of the most prominent technology and growth-oriented companies listed on the Nasdaq Stock Market.
| Holdings | Share |
|---|---|
| Microsoft Corp | 8.87% |
| Apple Inc | 7.53% |
| NVIDIA Corp | 6.29% |
| Amazon.com Inc | 5.48% |
| Meta Platforms Inc Class A | 5.04% |
| Broadcom Inc | 4.58% |
| Alphabet Inc Class A | 2.62% |
| Alphabet Inc Class C | 2.55% |
| Costco Wholesale Corp | 2.36% |
| Tesla Inc | 2.18% |
| Netflix Inc | 1.99% |
| Advanced Micro Devices Inc | 1.96% |
| PepsiCo Inc | 1.71% |
| Adobe Inc | 1.60% |
| Linde PLC | 1.60% |
| Cisco Systems Inc | 1.44% |
| T-Mobile US Inc | 1.41% |
| Qualcomm Inc | 1.40% |
| Applied Materials Inc | 1.29% |
| Intuit Inc | 1.27% |
Trading Strategies for QQQ ETF
When it comes to trading the QQQ ETF, investors have a plethora of strategies at their disposal, each tailored to suit varying risk appetites, investment timeframes, and market conditions. Here’s an in-depth exploration of some popular trading strategies for QQQ.
Trend Following Strategy
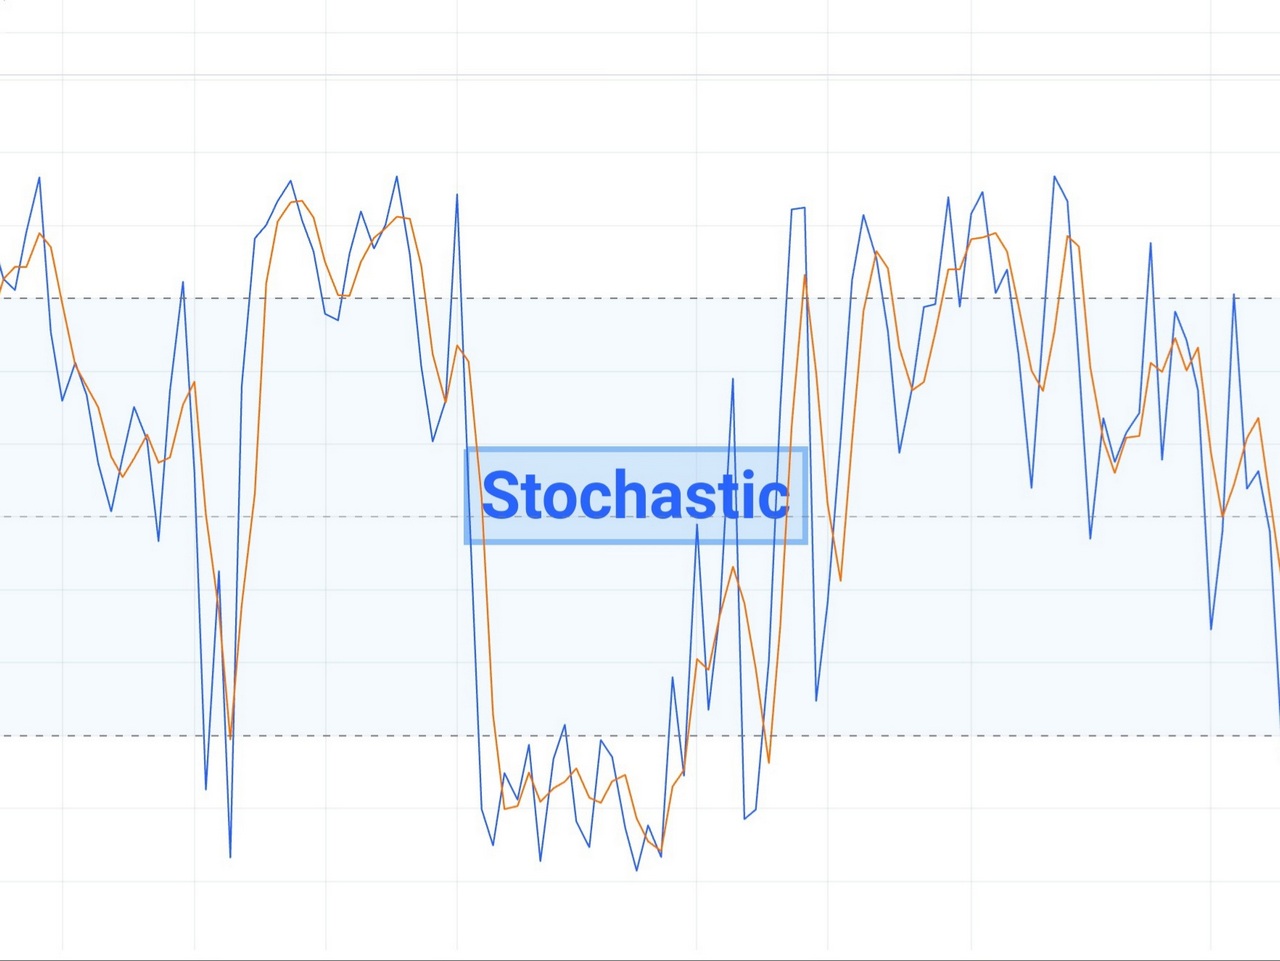
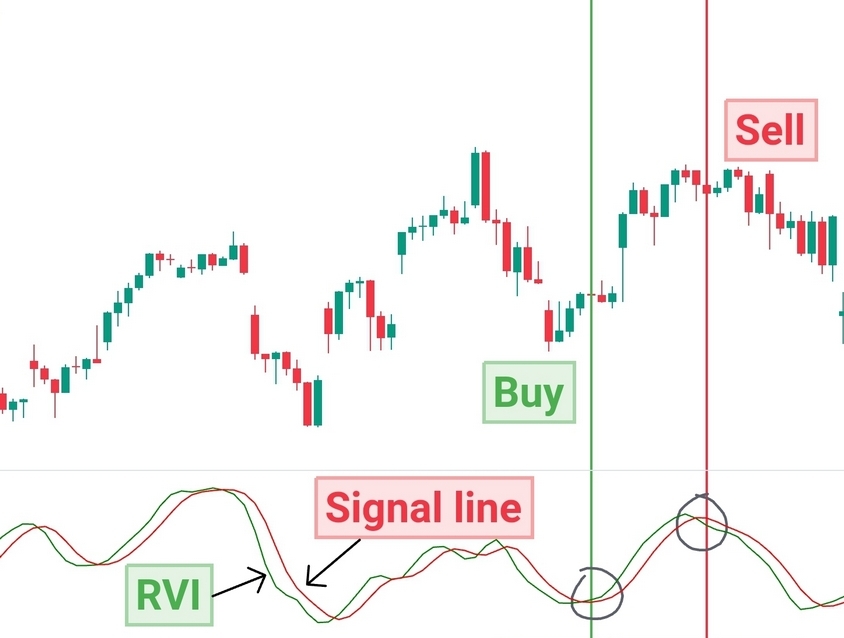
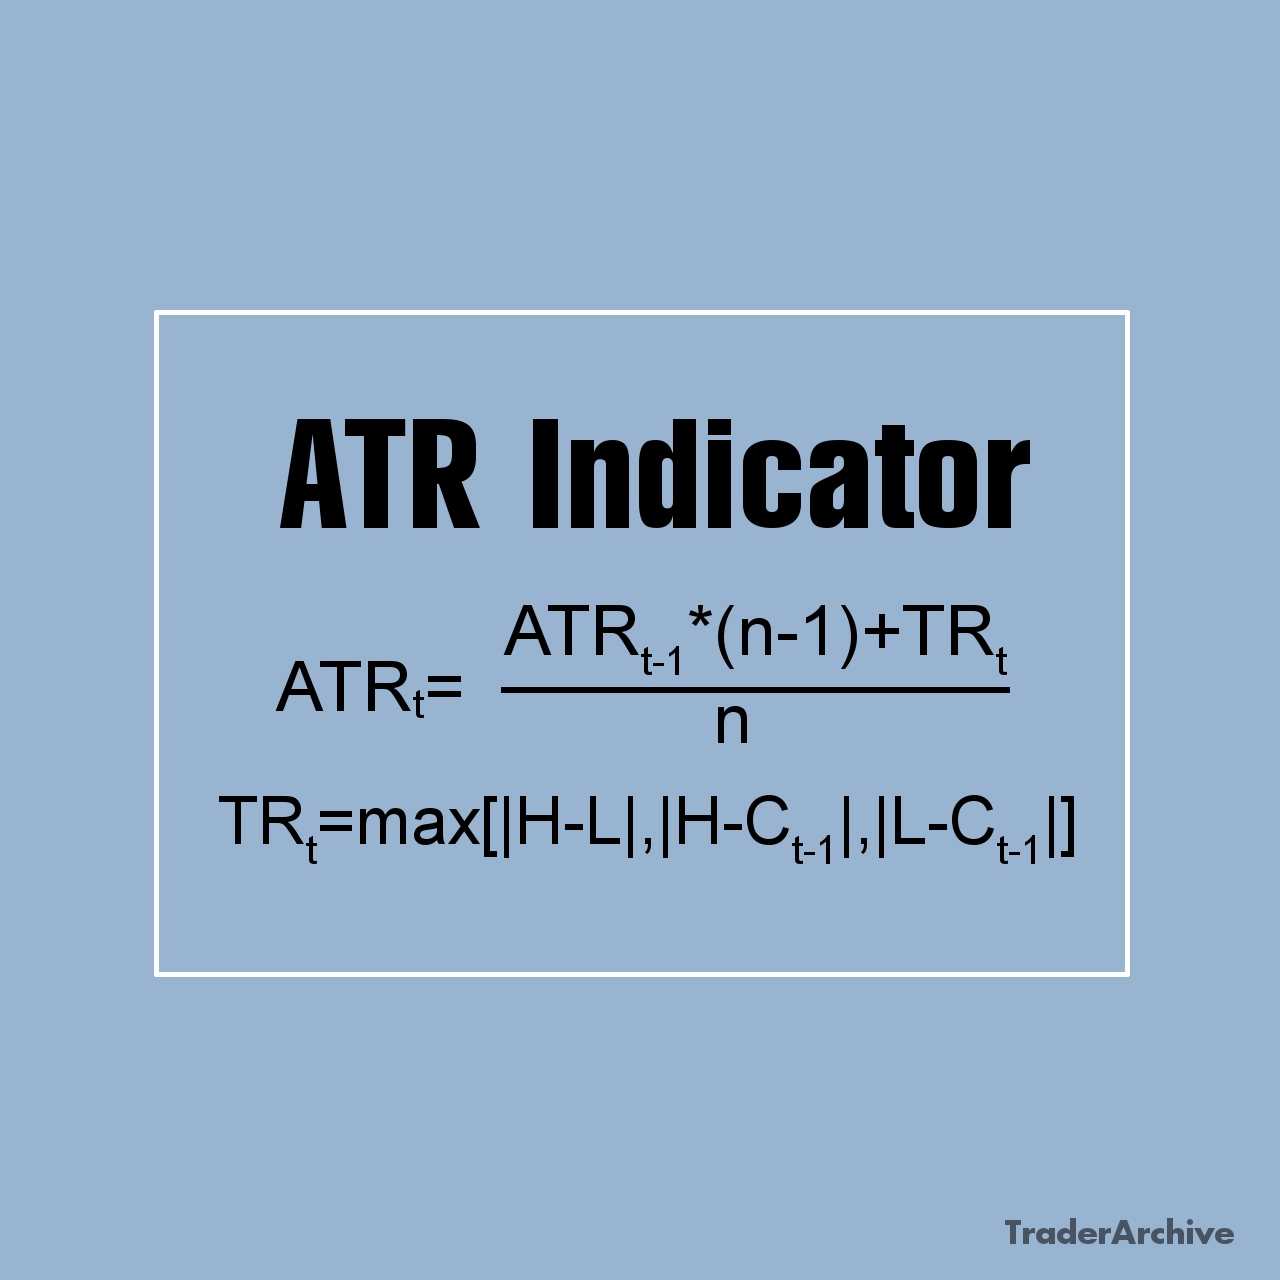
Trend following is a popular strategy utilized by traders to capture directional movements in asset prices. For QQQ, trend followers leverage technical analysis tools (read section “Finding Signals with Technical Analysis and Indicators” below) such as moving averages, trendlines, and momentum oscillators to identify and capitalize on prevailing trends in the ETF’s price movements. By analyzing historical price data and identifying patterns indicative of upward or downward momentum, traders aim to enter positions in alignment with the dominant trend. This strategy requires disciplined adherence to predefined entry and exit criteria to capitalize on trend continuations while mitigating the risk of false signals.
Sector Rotation Strategy
Sector rotation strategies involve monitoring sectoral performance within the Nasdaq-100 index and adjusting QQQ exposure accordingly. As the composition of the index evolves and sectoral dynamics shift, investors may reallocate their QQQ holdings to capitalize on sector-specific opportunities and mitigate risks. For instance, during periods of heightened volatility or economic uncertainty, investors may tilt their exposure towards defensive sectors like healthcare or consumer staples, while reducing exposure to more cyclical sectors like technology. By actively managing sector allocations, investors seek to optimize risk-adjusted returns and capitalize on emerging trends within the broader market landscape.
QQQ ETF Options Trading Strategies
Active option market of the QQQ ETF provides opportunity for options trading and offers a versatile toolkit for investors seeking to enhance returns, manage risk, and generate income from QQQ positions. Various options strategies can be employed, including:
- Covered Calls: Selling call options against existing QQQ holdings to generate income while potentially capping upside gains.
- Protective Puts: Purchasing put options as insurance against downside risk in QQQ holdings, providing downside protection while allowing participation in potential upside movements.
- Straddles: Implementing a long straddle strategy by simultaneously purchasing a call option and a put option with the same strike price and expiration date, anticipating significant price volatility in QQQ and aiming to profit from substantial price swings in either direction.
Pairs Trading Strategy
Pairs trading strategy involves identifying pairs of assets related to the QQQ ETF within the technology sector. Traders then execute simultaneous long and short positions in QQQ and its counterpart to exploit relative price movements. Traders seek to capitalize on deviations from historical price relationships between correlated assets, aiming to profit from mean reversion as prices converge over time. By carefully selecting correlated assets and monitoring their price dynamics, pairs traders can generate alpha while minimizing exposure to broader market trends and systematic risk.
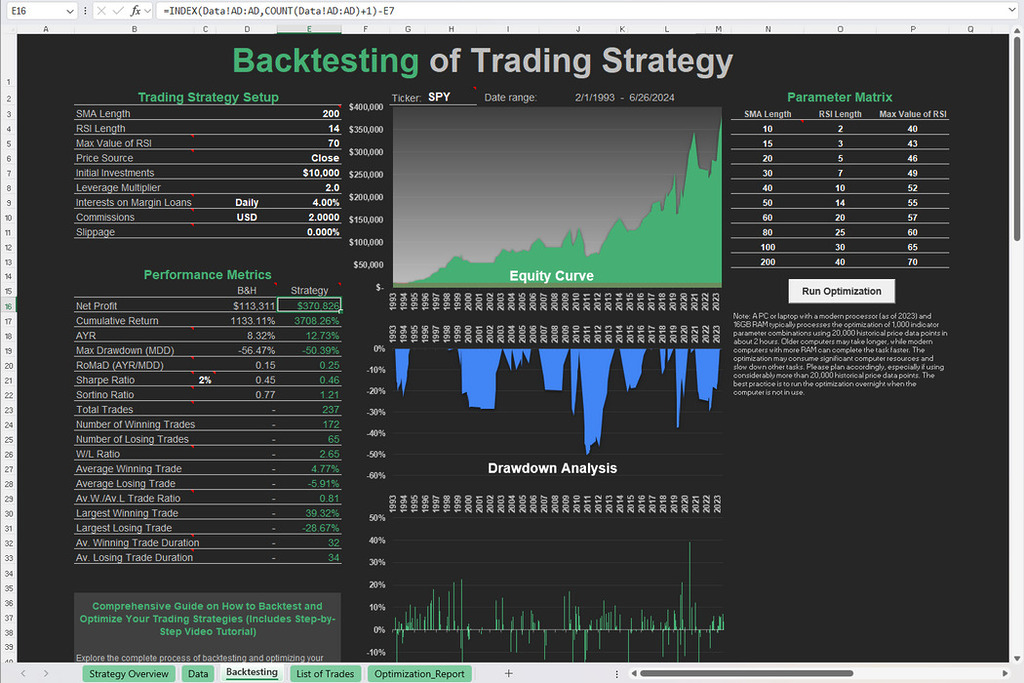
Free Backtesting Spreadsheet
Event-Based Trading
Event-based trading strategies revolve around capitalizing on significant market events, earnings announcements, product launches, or macroeconomic developments that impact the performance of QQQ and its underlying constituents. By closely monitoring news flow and event calendars, traders seek to anticipate market reactions and position themselves accordingly to capitalize on price volatility and directional movements triggered by key events. This strategy requires a keen understanding of market sentiment, fundamental analysis, and the ability to react swiftly to evolving market dynamics.
Finding Signals with Technical Analysis and Indicators
Technical analysis plays an important role in trading the QQQ ETF, providing traders with valuable insights into price trends, momentum, and potential entry and exit points. Here’s an overview of some commonly used technical analysis tools and indicators when trading QQQ.
Moving Averages
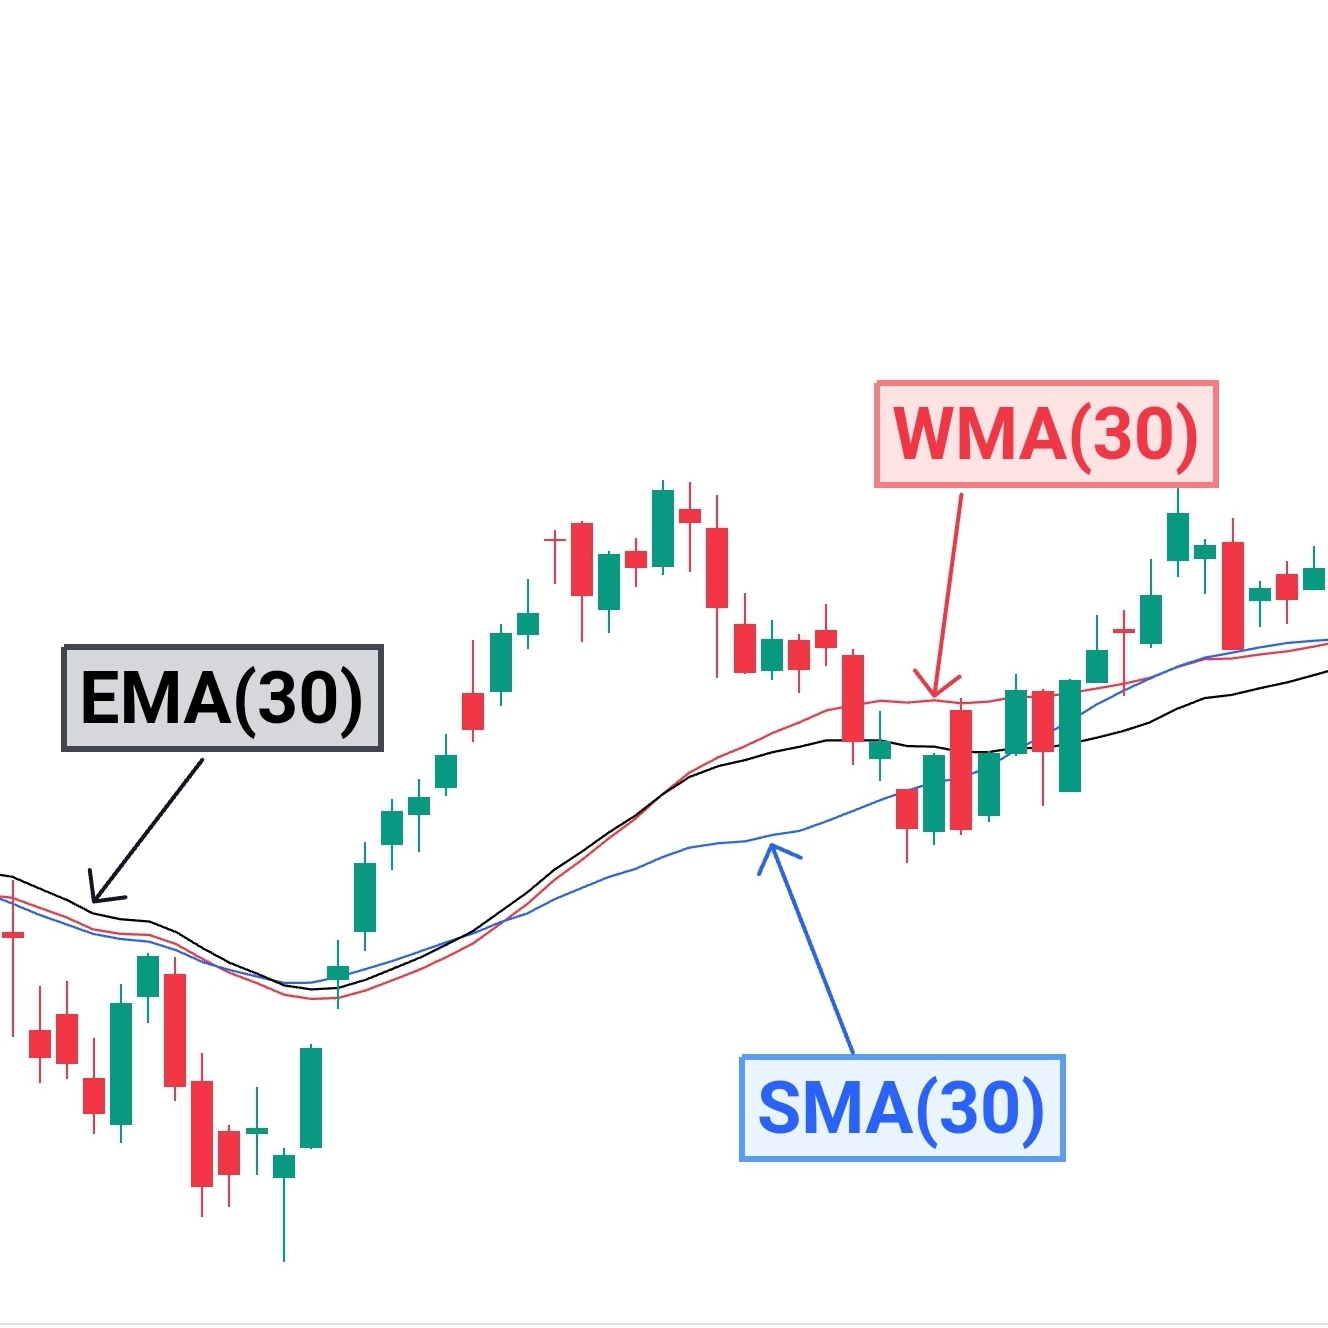
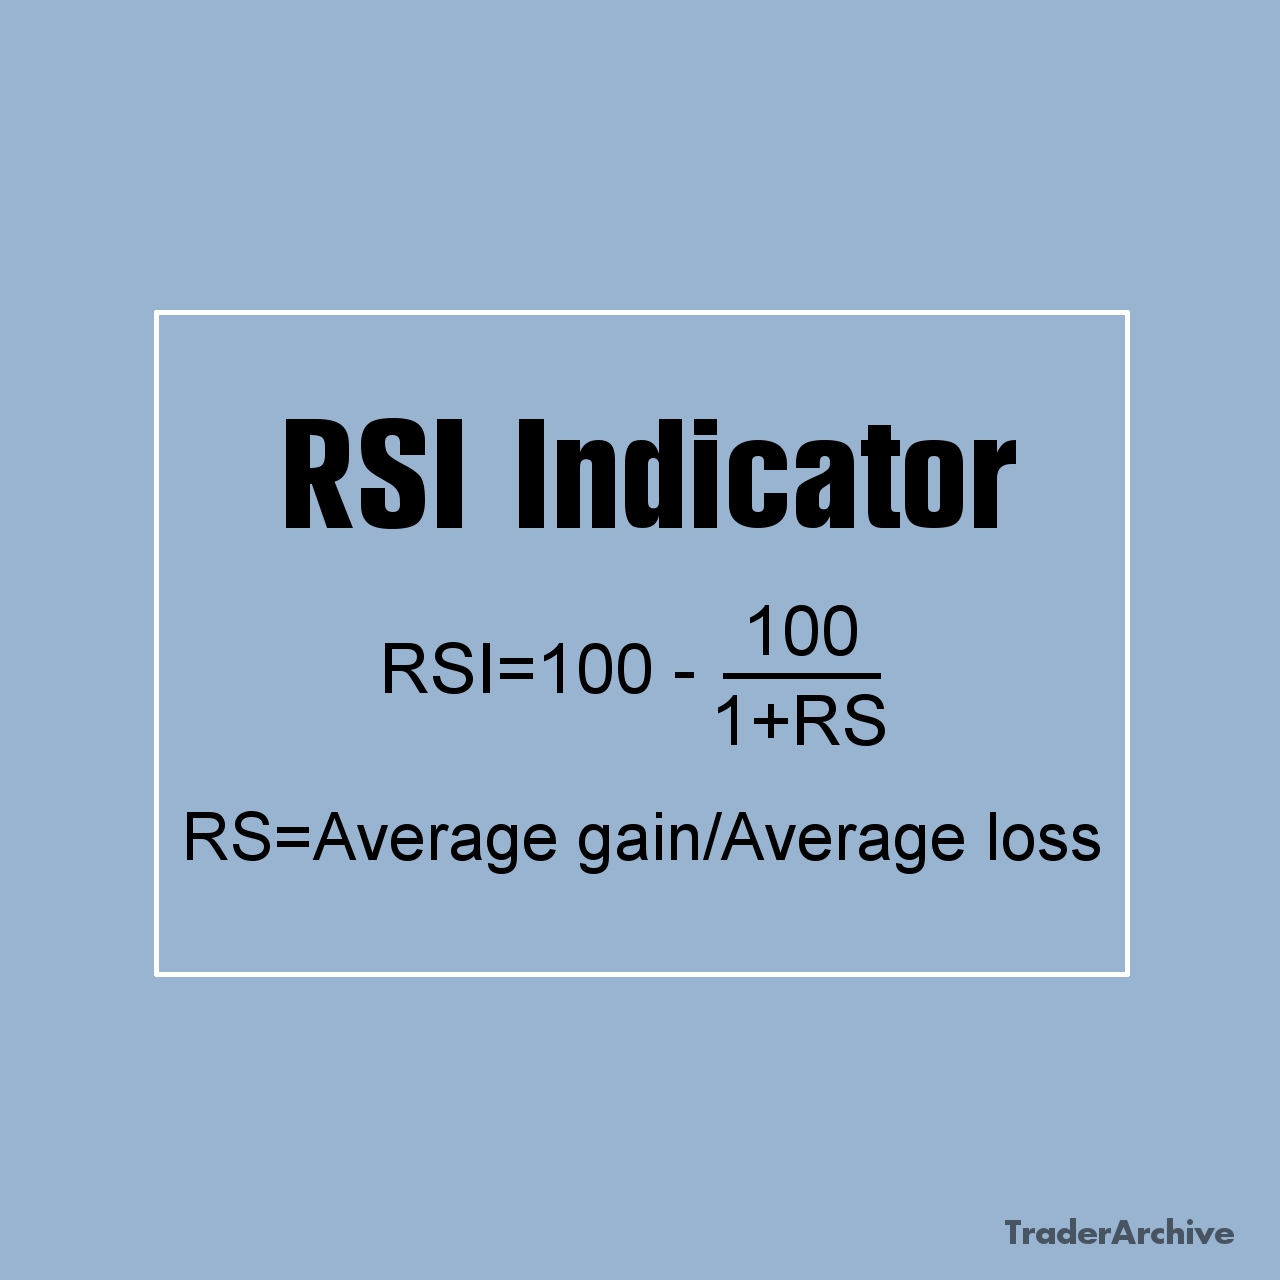
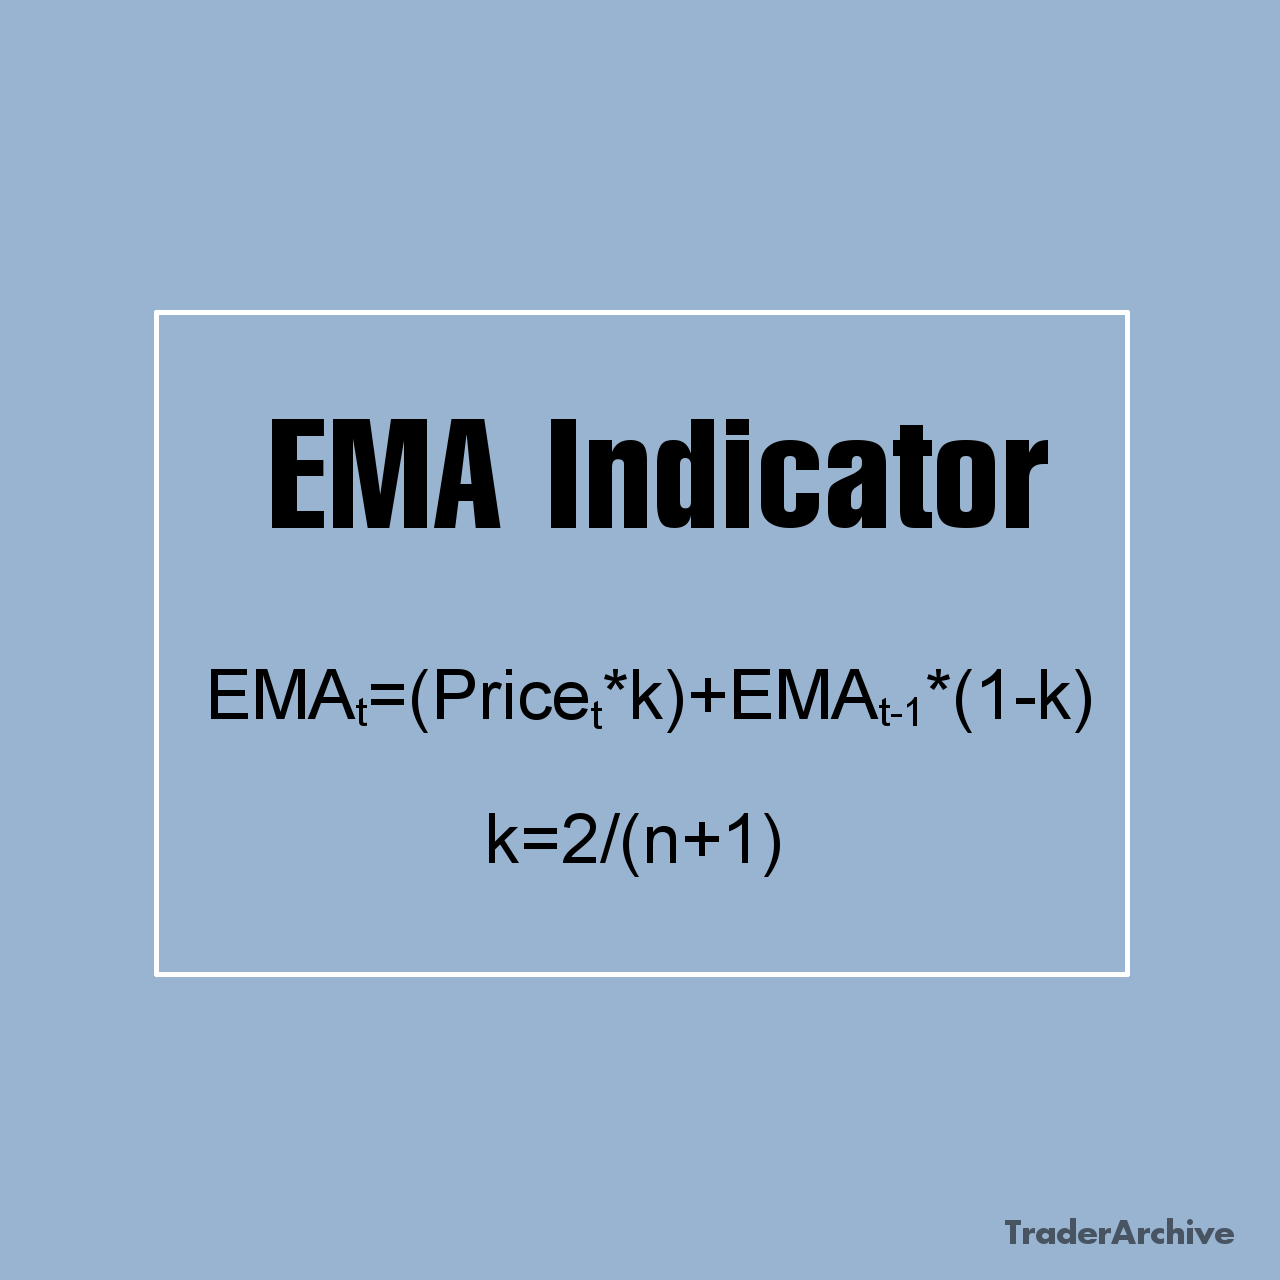
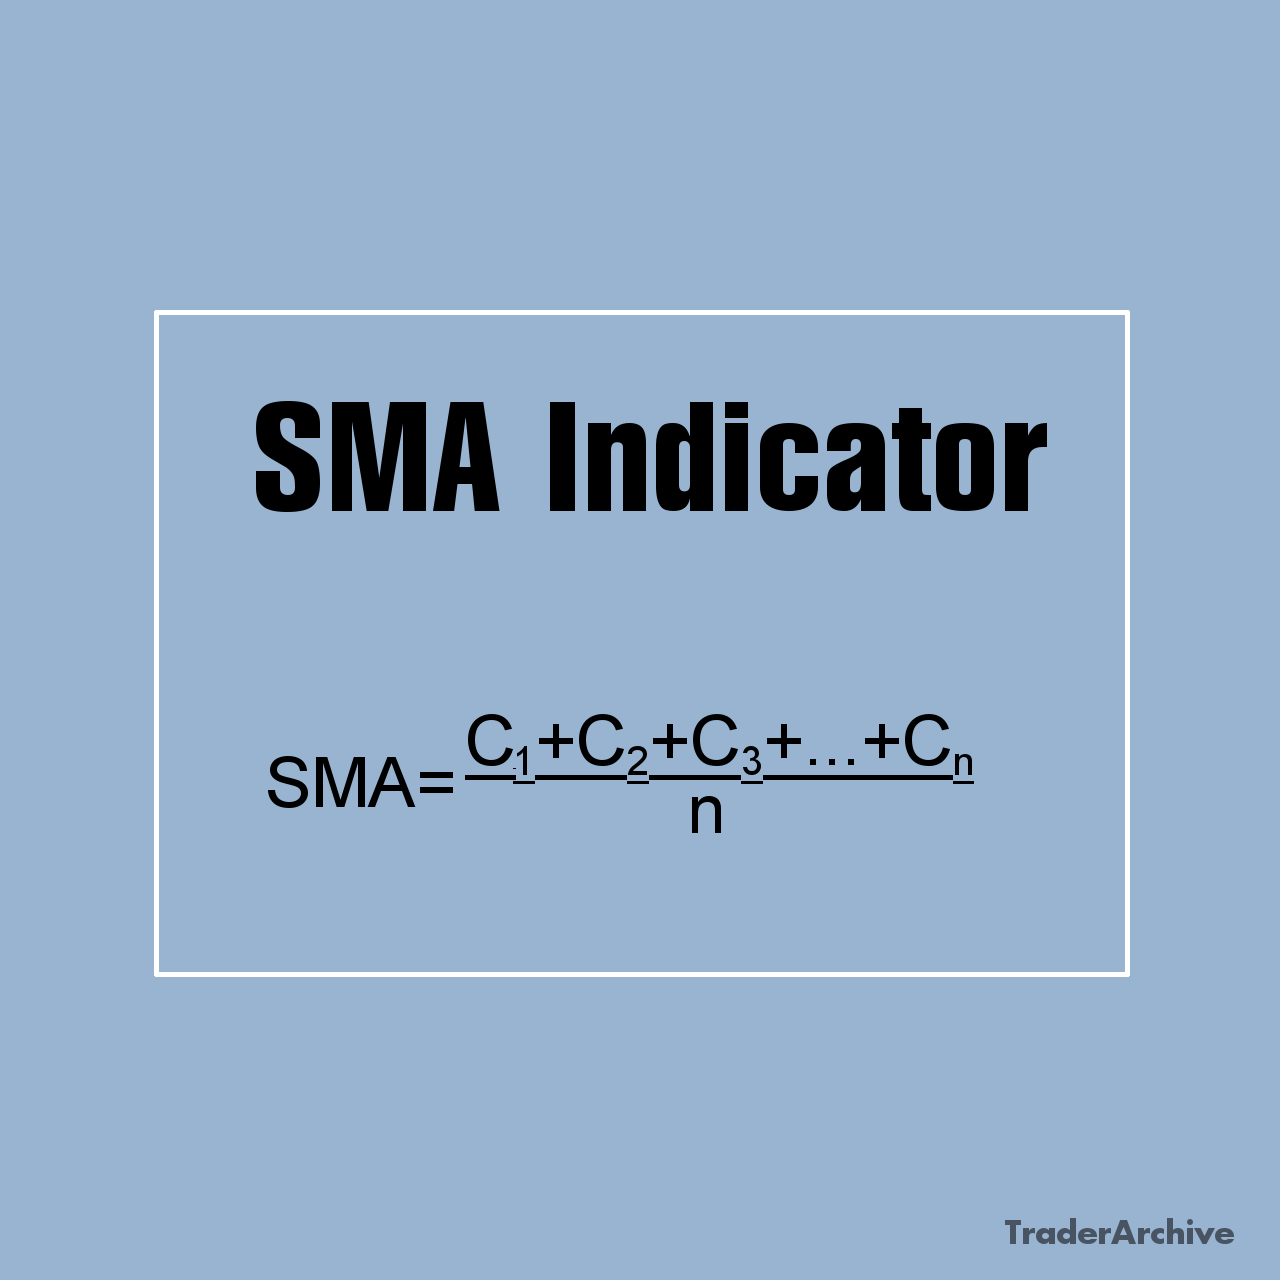
Moving averages are widely used to identify trends and smooth out price fluctuations. Traders often use simple moving averages (SMA) and exponential moving averages (EMA) to identify trend reversals, with crossovers between short-term and long-term moving averages signaling potential entry or exit points.
Relative Strength Index
The relative strength index (RSI) is a momentum oscillator that measures the speed and change of price movements. It ranges from 0 to 100 and is used to identify overbought or oversold conditions in the market. Traders typically look for divergences between the RSI and price movements to anticipate trend reversals.
Bollinger Bands
Bollinger Bands consist of a middle line (usually a simple moving average) and two outer bands that represent standard deviations from the middle line. They are used to identify volatility and potential price reversals. When the price touches or crosses the outer bands, it may indicate overbought or oversold conditions.
Chart Patterns
Chart patterns, such as triangles, flags, and head and shoulders formations, are visual representations of price movements that traders use to predict future price movements. Recognizing these patterns in QQQ’s price chart can help traders identify potential breakout or reversal opportunities.
Support and Resistance Levels
Support and resistance levels are areas on the price chart where the price tends to find barriers to further movement. Traders use these levels to identify potential entry and exit points for trades. Breakouts above resistance or breakdowns below support levels can signal significant price movements in QQQ.
Risk Considerations
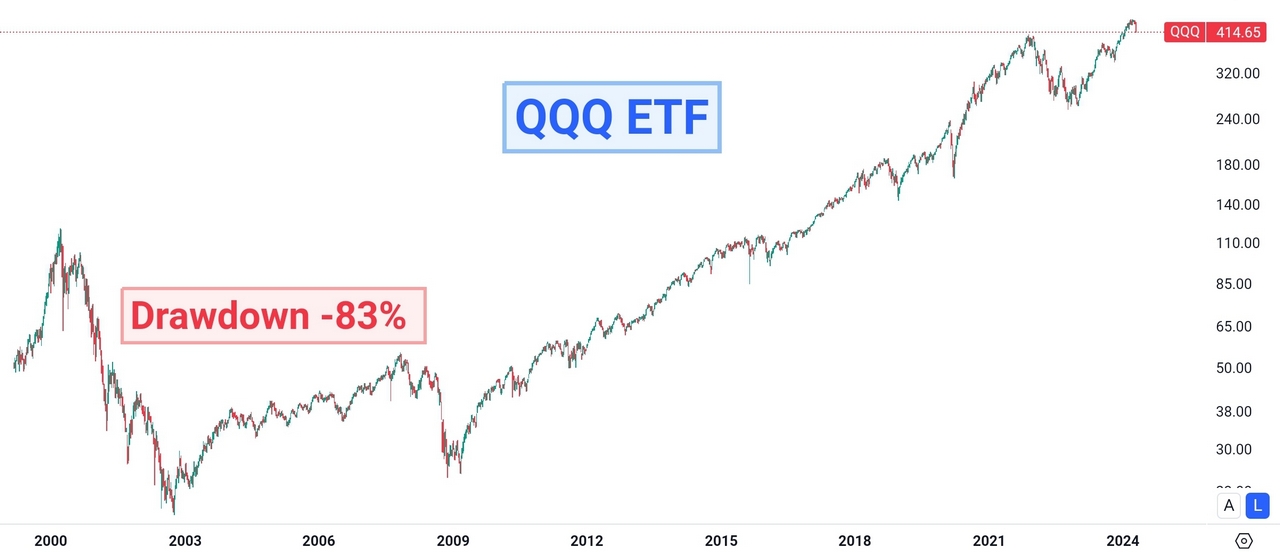
The QQQ ETF price chart 1999-2024 (logarithmic)/TradingView
While the QQQ ETF offers compelling opportunities for investors, it’s essential to acknowledge and manage associated risks. Some key risk considerations include:
- Sector Concentration Risk: Given QQQ’s heavy exposure to the technology sector, the ETF is susceptible to adverse developments, regulatory scrutiny, or shifts in investor sentiment within the tech industry. The dot-com bubble of the late 1990s serves as a historical example of sector concentration risk, where QQQ experienced significant volatility and drawdowns as overvaluation and subsequent correction affected many technology stocks.
- Volatility and Market Risk: Tech stocks, by nature, can be volatile, leading to amplified price swings and heightened market risk for QQQ investors, especially during periods of market turbulence or economic uncertainty.
- Interest Rate and Inflation Risk: Changes in interest rates and inflation dynamics can impact the performance of growth-oriented stocks within QQQ, influencing investor sentiment and market valuations.
Final Thoughts
In conclusion, trading the QQQ ETF presents investors with a valuable avenue to participate in the dynamic technology sector and leverage the growth potential of Nasdaq-listed companies. By gaining insights into the index, historical performance, constituent components, trading tactics, and risk factors linked to QQQ, investors can better navigate market intricacies and position themselves strategically in the finance landscape. However, prudent research, diligence, and portfolio diversification remain paramount in managing risks and maximizing returns, not only in QQQ but across all investment endeavors.
Share on Social Media:


