The stochastic oscillator, developed by George C. Lane in the late 1950s, aims to measure the momentum of price movements. It compares the most recent closing price of a security to its price range over a specified time period. The oscillator is bound between 0 and 100, indicating overbought conditions when it surpasses the 80 threshold and oversold conditions when it falls below 20.
The Stochastic Oscillator Formula
The formula for the stochastic oscillator involves three main components:
- %K: Represents the current closing price relative to the range of prices over a specified period, typically 14 periods.

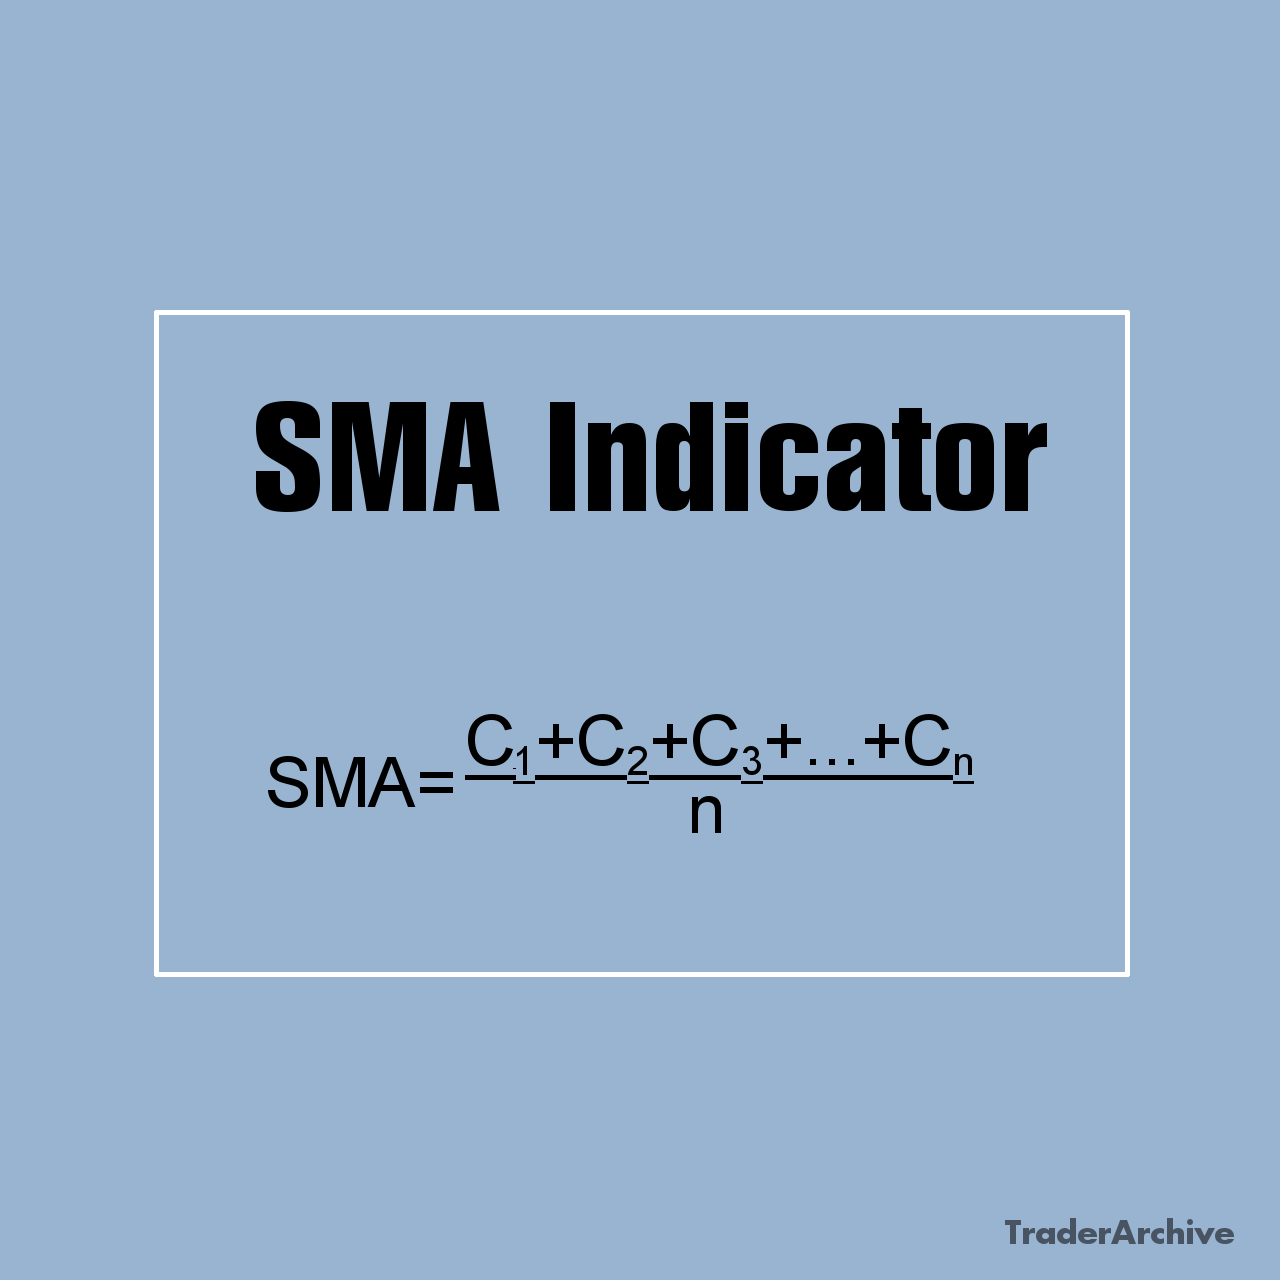
- %D: A moving average of %K, typically a three-period simple moving average (SMA) of %K.
- Smoothing: Some variations of the stochastic oscillator use smoothing techniques with SMA, to further refine the %K and %D values. In such case the formulas are following:
Smoothed %K = SMA of %K
%D = 3-period SMA of Smoothed %K
Applications of Stochastic Oscillator
The stochastic oscillator is a versatile tool used in various trading strategies and market conditions. In my personal experience, it is particularly efficient at identifying short-term trends in fast-moving markets.
Overbought and Oversold Conditions
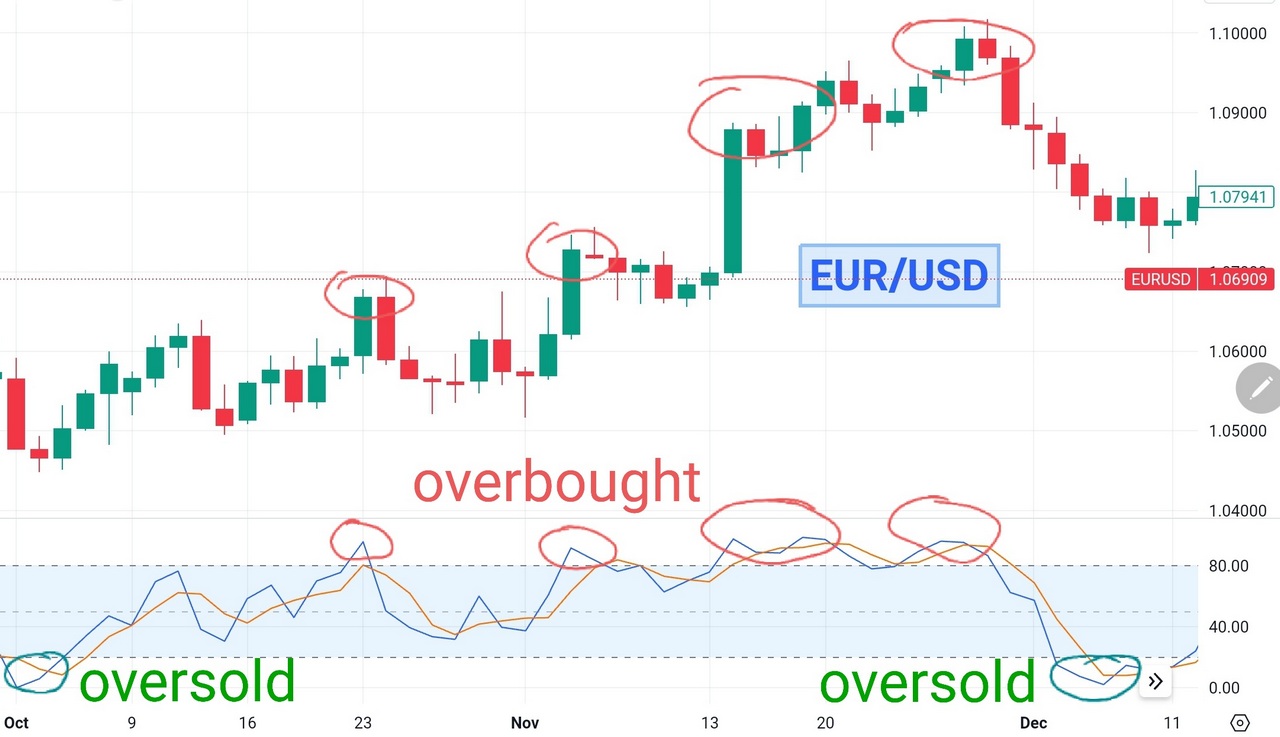
One of the primary applications of the stochastic oscillator is identifying overbought and oversold conditions in the market. When the oscillator rises above 80, it indicates that the instrument may be overbought. It suggests that the price has climbed too steeply and a correction may be imminent. In such scenarios, traders often consider selling or shorting the asset to capitalize on the anticipated price reversal. Conversely, when the stochastic oscillator falls below 20, it signals that the security may be oversold. Traders view this as a potential buying opportunity, expecting a rebound in prices.
Signal Line Crossings
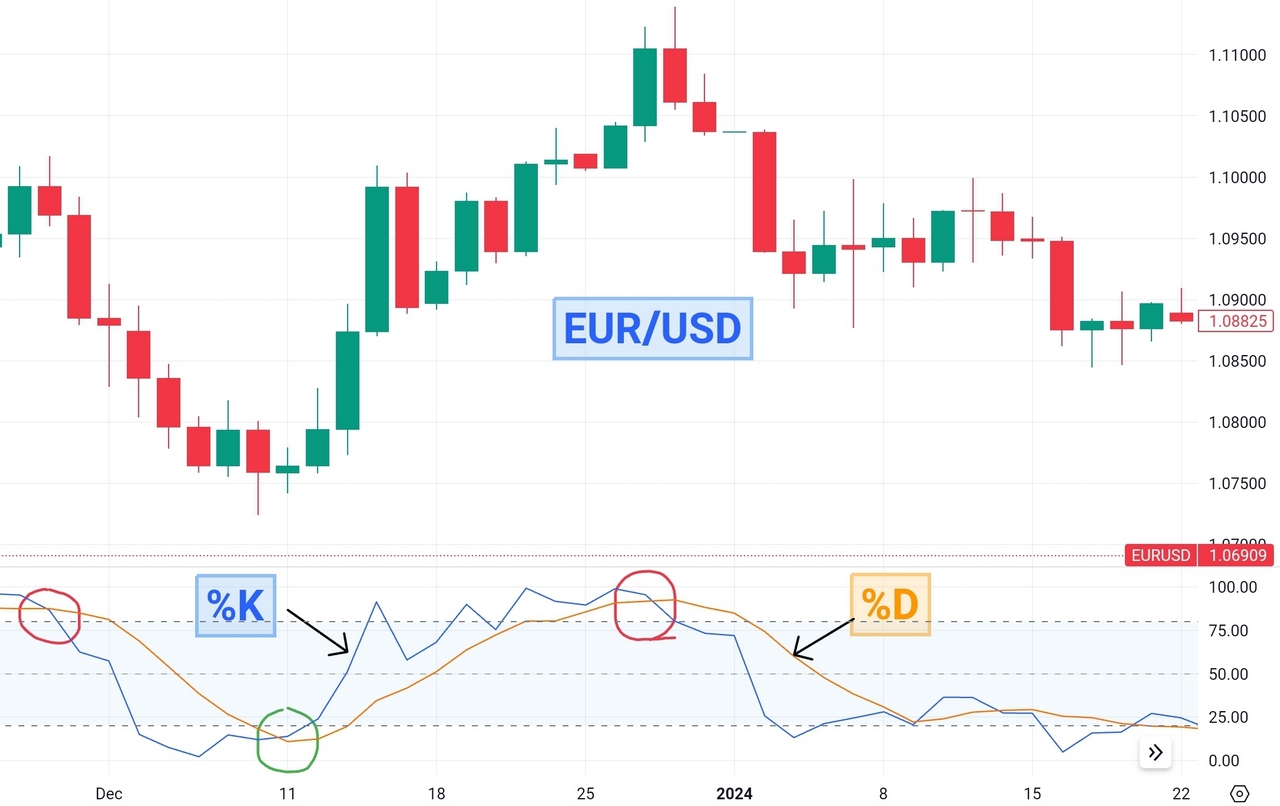
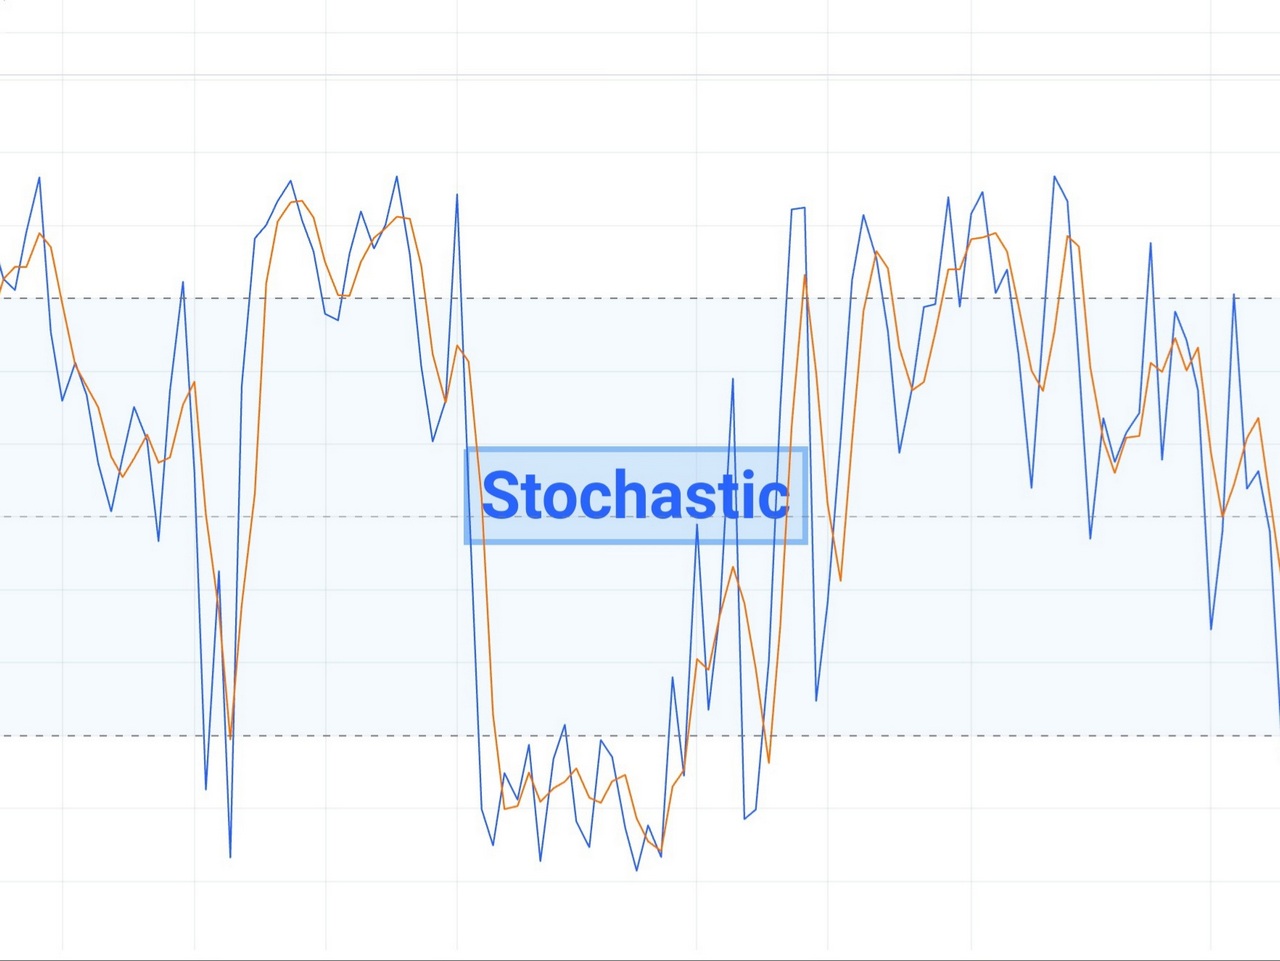
Crossovers between the %K and %D lines of the stochastic oscillator can generate valuable trading signals. A bullish signal occurs when the %K line crosses above the %D line, indicating strengthening momentum and potential price appreciation. This crossover suggests that buying pressure is increasing, potentially leading to upward price movement. Conversely, a bearish signal occurs when the %K line crosses below the %D line, signaling weakening momentum and potential price decline.
Divergence
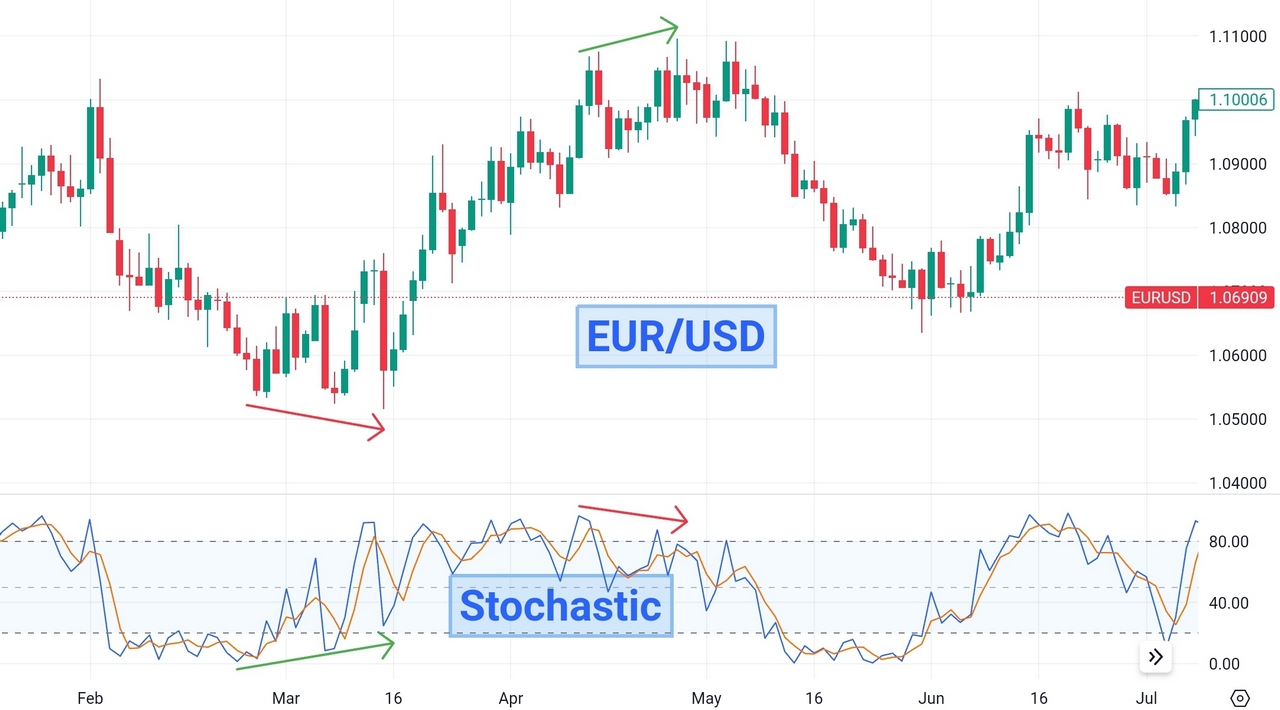
Divergence analysis is another powerful application of the stochastic oscillator. Divergence occurs when the price trend moves in the opposite direction of the oscillator, providing early indications of potential trend reversals. Bullish divergence occurs when the price forms lower lows while the stochastic oscillator forms higher lows. This divergence suggests that downward momentum is weakening, potentially signaling a reversal to the upside. Conversely, bearish divergence occurs when the price forms higher highs while the stochastic oscillator forms lower highs, indicating weakening upward momentum and a potential reversal to the downside.
Stochastic for Range-Bound Markets
As I mentioned before, the stochastic oscillator identifies short-term price movements effectively, making it particularly valuable in range-bound or sideways markets. By pinpointing overbought and oversold levels, it helps you identify potential entry and exit points within the trading range. If you look for buy signals near oversold levels and sell signals near overbought levels, this indicator can help you capitalize on short-term price fluctuations within the range.
Tips for Effective Use of Stochastic Oscillator
To maximize the effectiveness of the stochastic oscillator in trading strategies, consider the following tips:
- Use Multiple Timeframes: Validate signals generated by the stochastic oscillator across multiple timeframes to confirm trend direction and avoid false signals.
- Combine with Other Indicators: Combine the stochastic oscillator with other technical indicators, such as moving averages, trendlines, or volume analysis, to enhance signal accuracy and reduce false signals.
- Practice Risk Management: Implement proper risk management techniques, such as setting stop-loss orders and position sizing, to mitigate potential losses and preserve capital.
- Stay Informed: Stay informed about market news, economic events, and geopolitical developments that may impact price movements and invalidate signals generated by the stochastic oscillator.
- Backtest and Refine: Backtest trading strategies incorporating the stochastic oscillator on historical data to assess performance and refine parameters for optimal results.
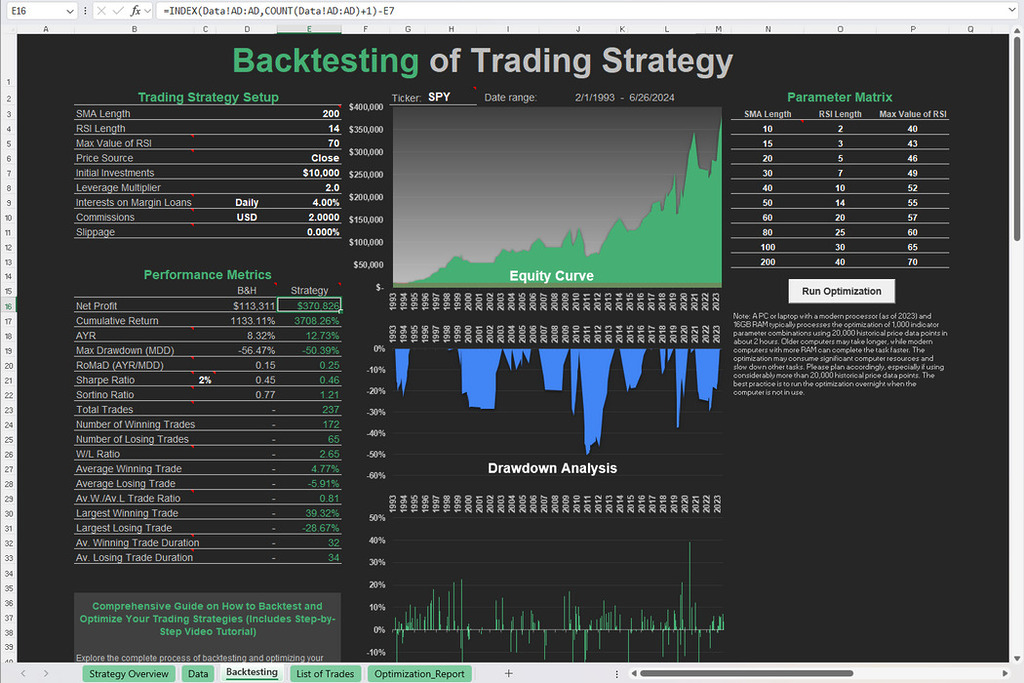
Free Backtesting Spreadsheet
Challenges Associated with the Stochastic Oscillator
Of course, no indicator is perfect, and they can generate false signals. The stochastic oscillator (SO) is no exception. False signals occur during periods of market volatility or, to be more correct, during sudden volatility changes when price fluctuations can be erratic and unpredictable. Traders may find themselves entering trades based on SO signals, only to see the market move in the opposite direction, resulting in losses.
To address the issue of false signals, you can apply various techniques to filter out unreliable signals and increase the accuracy of your trading strategy. One common approach is to use the prevailing price trend as a filter for SO signals. By only considering signals that align with the direction of the trend, you can increase the probability of successful trades and reduce influence of false signals. Another effective approach is backtesting on historical data that covers different market conditions, including periods of volatility. This allows you to train your strategy to handle such periods more efficiently.
Backtesting with Historical Data and Excel Spreadsheet
Backtesting is a crucial step in evaluating the effectiveness of trading strategies, including those incorporating the SO. By testing a strategy against historical data, you can assess its performance, identify strengths and weaknesses, and refine parameters for optimal results. In this chapter, we’ll explore how to conduct backtesting using historical data and an Excel spreadsheet, focusing on a simple example of a stochastic oscillator-based strategy.
Historical Data Collection
The first step in backtesting is to collect historical price data for the asset or market you want to analyze. Numerous sources provide free or paid access to historical price data, including financial websites, data vendors, and trading platforms. You can start with Investing.com which provides free historical data in 1D time frame. Once you have obtained the data, organize it in a spreadsheet format with columns for date, open, high, low, close prices.
Excel Spreadsheet Setup
Create a new Excel spreadsheet and input the historical price data into separate columns. Next, calculate the SO values (%K and %D) based on the formula discussed earlier for each period in the dataset. Use Excel functions or formulas to perform these calculations automatically. You can download Excel template for stochastic oscillator which was created for your convenience.
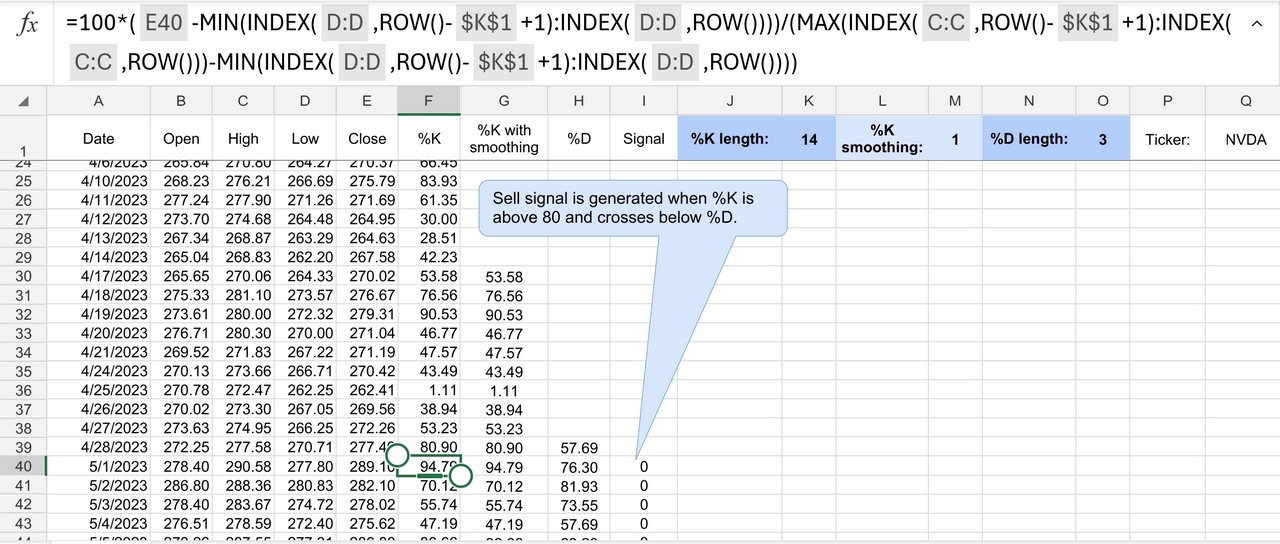
Based on your strategy rules, determine when buy and sell signals would have been generated during the historical period. For example, if your strategy requires the %K line to cross above 20 for a buy signal, identify the dates when this condition was met. Likewise, identify dates for sell signals based on the %K line crossing below 80.
Performance Analysis
Once you have identified buy and sell signals, calculate the corresponding returns or profits/losses for each trade. Track metrics such as total return, maximum drawdown, win rate, average gain, and average loss. These metrics provide insights into the strategy’s performance and risk-adjusted returns. Visualize the strategy’s performance using charts and graphs in Excel. Plot the equity curve, showing the cumulative returns over time, as well as other relevant metrics such as drawdowns and trade distribution. Visual representations help identify patterns, trends, and areas for improvement.
Sensitivity Analysis and Optimization
Conduct sensitivity analysis by varying key parameters of the strategy, such as the lookback period for the SO or the threshold levels for overbought and oversold conditions. Assess how changes in these parameters affect the strategy’s performance and stability. Based on the results of the backtest and sensitivity analysis, refine the strategy parameters to improve performance or address any weaknesses.
Final Thoughts
The SO is a valuable tool in technical analysis, offering insights into market momentum and trading opportunities. From identifying overbought and oversold conditions to generating signals and analyzing divergence, it aids traders across various market scenarios. Despite its versatility, the oscillator is not without limitations, such as false signals during volatile periods. Traders often use trend filtering to enhance signal accuracy. Backtesting strategies with historical data and Excel aids in refining approaches for better performance.
Share on Social Media:

Leave a Reply