In the ever-evolving world of financial markets, investors and traders constantly seek strategies to gain an edge and maximize profits. Among the myriad of approaches, technical analysis stands out as a powerful tool for analyzing past market data to predict future price movements. Unlike fundamental analysis, which focuses on a company’s financial health and economic factors, technical analysis relies solely on historical price and volume data to identify trends and patterns.
Technical analysis is founded on the belief that market prices reflect all available information and that price movements tend to follow recognizable patterns. By studying charts and employing various technical indicators, analysts aim to uncover potential trading opportunities and make informed decisions. In this comprehensive guide, we will delve into the intricacies of technical analysis, exploring its key principles, methods, and practical applications.
Key Principles of Technical Analysis
- Price Discounts Everything: The cornerstone principle of technical analysis is the notion that all relevant information, including market fundamentals, economic factors, and investor sentiment, is already reflected in the price of an asset. Therefore, analysts primarily focus on price action to make predictions about future movements.
- Price Moves in Trends: Another fundamental tenet is that prices tend to move in trends, exhibiting persistent directional movement over time. These trends can be upward (bullish), downward (bearish), or sideways (neutral), providing valuable insights into market sentiment and potential trading opportunities.
- History Tends to Repeat Itself: Technical analysts believe that historical price patterns and behaviors tend to repeat themselves due to the collective psychology of market participants. By identifying recurring patterns and formations, analysts aim to anticipate future price movements with a reasonable degree of accuracy.
- Support and Resistance Levels: Support and resistance levels represent key price levels where buying and selling pressure converge, often leading to reversals or continuation of trends. Support levels act as price floors, where buying interest tends to increase, while resistance levels serve as price ceilings, where selling pressure intensifies.
Charles Dow on Technical Analysis
Charles Dow, the founder of The Wall Street Journal and co-founder of Dow Jones & Company, is widely regarded as one of the pioneers of modern technical analysis. His groundbreaking work laid the foundation for many of the principles and concepts that form the basis of technical analysis today. By introducing key theories and developing the Dow Theory, Charles Dow revolutionized the way investors analyze financial markets and paved the way for future generations of traders and analysts.
Perhaps Dow’s most significant contribution to technical analysis is the development of the Dow Theory, which seeks to identify trends in the stock market and forecast future price movements. The theory is based on six fundamental principles, including the idea that market trends have three distinct phases – the primary trend, secondary reactions, and minor fluctuations.
Charles Dow emphasized the importance of studying price movements and volume patterns to discern market trends and investor sentiment. His focus on price action analysis laid the groundwork for future technical analysts to develop charting techniques and identify key support and resistance levels.
Principles of Dow Theory
Dow’s pioneering work on the Dow Theory introduced several key principles that remain integral to technical analysis:
a. The Trend is Your Friend: Dow believed that markets trend in identifiable patterns, with major trends persisting over extended periods. Traders should align themselves with the prevailing trend to maximize profits and avoid fighting the market.
b. Confirmation: According to Dow Theory, trends are confirmed by movements in related indices. For example, a bullish trend in the Dow Jones Industrial Average (DJIA) should be accompanied by a similar upward movement in the Dow Jones Transportation Average, signaling broad-based strength in the market.
c. Volume Confirmation: Dow stressed the importance of volume as a confirming indicator of price movements. Increasing volume during an uptrend suggests strong buying interest, while declining volume during a downtrend may indicate weakening momentum.

Free Backtesting Spreadsheet
Methods of Technical Analysis
Technical analysis encompasses a variety of methods and tools that traders use to analyze price movements and make informed decisions in financial markets. Here, we explore four key methods of technical analysis in detail:
Chart Patterns in Technical Analysis
Chart patterns are visual representations of price movements that recur over time, providing valuable insights into market psychology and potential trend reversals or continuations. These patterns form because of the collective behavior of market participants, reflecting shifts in supply and demand dynamics. By recognizing and interpreting these patterns, traders can anticipate future price movements and make informed trading decisions.
Common chart patterns include:
- Triangles: Triangle patterns form when the price consolidates between converging trendlines, signaling a period of indecision in the market. Symmetrical triangles, ascending triangles, and descending triangles are among the most common variations, each with its own implications for future price direction.
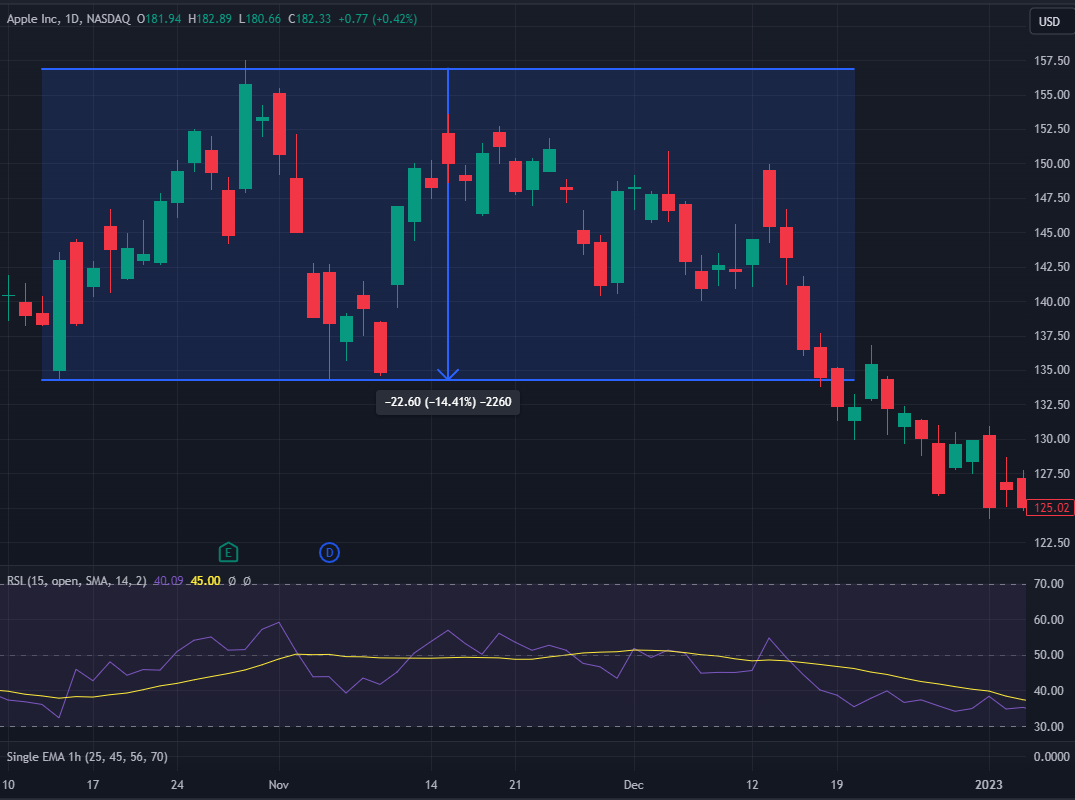
- Rectangles: Rectangle patterns represent a period of consolidation where the price trades within a horizontal range, indicating a temporary pause in the prevailing trend. Traders often look for breakout or breakdown signals to capitalize on potential price movements following the consolidation phase.
- Head and Shoulders: The head and shoulders pattern consists of three peaks, with the middle peak (the head) being higher than the two surrounding peaks (the shoulders). This pattern typically signals a reversal of an uptrend, with the neckline acting as a key level of support/resistance.
- Double Tops/Bottoms: Double tops pattern and double bottoms pattern occur when the price fails to break through a previous high or low, respectively, signaling a potential reversal in the prevailing trend. These patterns are characterized by two consecutive peaks or troughs at approximately the same level, followed by a reversal in price direction.
By identifying and understanding these chart patterns, traders can gain valuable insights into market sentiment and anticipate potential trend reversals or continuations.
Technical Indicators
Technical indicators are mathematical calculations applied to price and volume data to generate trading signals and identify potential trend reversals or strength. These indicators help traders analyze market dynamics and confirm signals generated by other technical analysis methods.
Some popular technical indicators include:
- Moving Averages: Moving averages smooth out price data by calculating the average price over a specified period, such as the simple moving average (SMA) or exponential moving average (EMA). During technical analysis the moving averages is used to identify trends, support/resistance levels, and potential entry/exit points.
- Relative Strength Index (RSI): The RSI measures the magnitude of recent price changes to determine whether an asset is overbought or oversold. This oscillator ranges from 0 to 100 and helps traders during technical analysis identify potential reversal points based on market momentum.
- Stochastic Oscillator: The stochastic oscillator compares the closing price of an asset to its price range over a specified period, typically 14 periods. This indicator oscillates between 0 and 100 and helps traders during technical analysis identify potential trend reversals or overbought/oversold conditions.
- MACD (Moving Average Convergence Divergence): The MACD measures the relationship between two moving averages and helps traders identify changes in momentum and potential trend reversals. The MACD line represents the difference between the 12-period and 26-period EMAs, while the signal line is the 9-period EMA of the MACD line.
By incorporating technical indicators into their analysis, traders can gain additional insights into market trends and potential trading opportunities.
Candlestick Analysis
Candlestick charts display price movements within a specific time, with each candlestick representing the open, high, low, and close prices for that period. Candlestick patterns provide valuable insights into market sentiment and potential reversals or continuations in price trends.
Some common candlestick patterns include:
- Doji: A doji occurs when the open and close prices are virtually the same, indicating indecision in the market. Depending on its context, a doji can signal potential reversals or continuation patterns.
- Hammer: A hammer candlestick has a small body and a long lower wick, indicating a rejection of lower prices and potential bullish reversal. The presence of a hammer pattern after a downtrend suggests a weakening of selling pressure and a possible trend reversal.
- Engulfing Patterns: Engulfing patterns occur when the body of one candle completely engulfs the body of the previous candle, signaling a potential reversal in price direction. Bullish engulfing patterns form at the bottom of downtrends, while bearish engulfing patterns form at the top of uptrends.
By analyzing candlestick patterns, traders can gauge market sentiment and identify potential turning points in price trends.
Volume Analysis
Volume is a crucial component of technical analysis, providing insights into the strength and sustainability of price movements. Changes in trading volume can help traders confirm the validity of price trends and anticipate potential trend reversals.
Key considerations in volume analysis include:
- Increasing Volume: Rising volume during price advances suggests strong buying interest and confirms the validity of an uptrend. Traders often look for spikes in volume to validate breakout signals and anticipate further price appreciation.
- Declining Volume: Conversely, declining volume during price rallies may indicate weakening momentum and potential trend reversals. A decrease in volume, especially after a prolonged uptrend, could signal a lack of conviction among buyers and a possible reversal in price direction.
- Volume Patterns: Traders also analyze volume patterns, such as volume spikes, volume divergences, and volume climaxes, to identify potential turning points in price trends. Unusual volume patterns often precede significant price movements and can provide valuable insights into market sentiment.
By incorporating volume analysis into their technical analysis toolkit, traders can gain a deeper understanding of market dynamics and make more informed trading decisions.
Practical Applications of Technical Analysis
- Trend Identification: Technical analysis helps traders identify prevailing trends and capitalize on potential opportunities. By analyzing charts and trend indicators, traders can determine whether a market is in an uptrend, downtrend, or consolidation phase, enabling them to align their strategies accordingly.
- Entry and Exit Points: Technical analysis provides traders with precise entry and exit points based on price patterns, support/resistance levels, and technical indicators. By waiting for confirmatory signals and adhering to predefined trading rules, traders can optimize their risk-reward ratios and enhance profitability.
- Risk Management: Effective risk management is paramount in trading, and technical analysis plays a crucial role in assessing and mitigating risks. By setting stop-loss orders, calculating position sizes based on risk tolerance, and employing proper risk-reward ratios, traders can safeguard their capital and minimize losses.
- Strategy Development: Technical analysis serves as the foundation for developing and backtesting trading strategies across various asset classes and timeframes. Whether utilizing trend-following, mean-reversion, or breakout strategies, traders can leverage technical indicators and patterns to gain a competitive edge in the markets.
Challenges and Limitations of Technical Analysis
- Subjectivity: Technical analysis relies on interpretation and subjective judgment, leading to potential biases and discrepancies among analysts. Different traders may interpret the same chart pattern or indicator differently, resulting in varying trading decisions and outcomes.
- False Signals: Despite its predictive power, technical analysis is not immune to false signals and market noise. Traders may encounter instances where indicators generate conflicting signals or fail to accurately predict price movements, leading to losses and frustration.
- Market Dynamics: Market conditions and dynamics can change rapidly, rendering historical patterns and indicators less reliable. Unexpected events, macroeconomic factors, and sudden shifts in investor sentiment can invalidate previously established trends and patterns, challenging traders’ ability to adapt.
- Overreliance on Indicators: Overreliance on technical indicators without considering broader market context and fundamentals can lead to suboptimal trading decisions. Traders must strike a balance between technical analysis and fundamental analysis to gain a comprehensive understanding of market conditions.
Final Thoughts
Technical analysis is a powerful tool for analyzing financial markets and making informed trading decisions based on historical price data and patterns. By adhering to key principles, employing various methods, and applying practical applications, traders can gain a competitive edge and enhance profitability. However, it is essential to recognize the challenges and limitations of technical analysis and supplement it with fundamental analysis and risk management techniques. Ultimately, mastering the art of technical analysis requires continuous learning, practice, and adaptation to evolving market dynamics.
Share on Social Media:


