Developed by J. Welles Wilder Jr. in the late 1970s, the relative strength index (RSI) has since become “must have” tool in technical analysis. Its main advantage is the ability to identify overbought and oversold conditions in a market. This article aims to cover various RSI strategies, exploring its entry/exit conditions, and possible optimization approaches.
Understanding the RSI
The relative strength index is a momentum oscillator that measures the speed and change of price movements. It oscillates between 0 and 100 and is typically plotted as a line graph beneath the price chart. The RSI is calculated using a formula that compares the magnitude of recent gains and losses over a specified period, usually 14 days, though this can be adjusted based on trader preference.
Interpreting RSI Readings
RSI readings provide insights into the strength and direction of price momentum. When the RSI surpasses 70, it suggests that the asset may be overbought, indicating a potential reversal or correction. Conversely, RSI values below 30 indicate oversold conditions, signaling a potential buying opportunity. However, it’s important to note that overbought and oversold conditions alone are not sufficient signals to base trading decisions on. Effective RSI strategies incorporate additional technical analysis tools and confirmation signals for optimal results.
Key RSI Strategies
RSI Divergence Strategy

Divergence is a potent signal that occurs when the price movement of an asset deviates from the behavior of the RSI. It’s a reflection of potential shifts in market sentiment and often serves as a precursor to trend reversals. Bullish divergence manifests when the price forms lower lows while the RSI forms higher lows. It suggests that selling pressure is waning despite continued downward movement in price. Such scenario implies a possible upward reversal in the near future. On the other hand, bearish divergence materializes when the price forms higher highs while the RSI forms lower highs, indicating weakening buying pressure amidst rising prices.
Overbought/Oversold Conditions

This is the most simple and popular RSI strategy, nevertheless, it is worth mentioning. Overbought conditions, indicated by RSI values exceeding 70, and oversold conditions, indicated by RSI values below 30, serve as potential entry and exit points. But this simple strategy may also generate many false signals, especially in prolonged bear or bull markets. That is why prudent traders exercise caution and seek confirmation from complementary signals, such as candlestick patterns or trendline breaks, before executing trades solely based on RSI readings.
RSI Trendline Breaks Strategy

Trendlines drawn on the RSI chart can help to understand trend strength and potential reversals. When the RSI breaches a downward trendline, it suggests a possible bullish reversal, indicating that selling pressure is subsiding and buyers may regain control. Conversely, a break below an upward trendline on the RSI signals a potential bearish reversal, implying weakening buying momentum and a possible shift towards selling pressure.
RSI and Moving Averages

The SPY ETF price chart and the RSI indicator with 15-periods SMA. TradingView
The integration of RSI with moving averages enhances the robustness of trading signals and helps filter out false signals. By combining RSI readings with moving average crossover strategies, you can gain valuable insights into trend direction and momentum. For instance, when the RSI crosses above a moving average, it may indicate the onset of a bullish trend. Conversely, a crossover below the moving average could indicate the increase of selling pressure.
RSI Momentum Strategies
According to RSI momentum strategies you can open long positions when the RSI crosses above 50 threshold, signaling bullish momentum. This suggests that buying pressure is strengthening, potentially leading to further price appreciation. To secure profits, you may exit long positions when the RSI rises above another threshold, such as 70, indicating overbought conditions and a potential reversal. Conversely, short positions could be initiated when the RSI crosses below 50, signaling bearish momentum, and exited when it falls below 30, suggesting oversold conditions and a potential rebound.
Advanced RSI Strategies
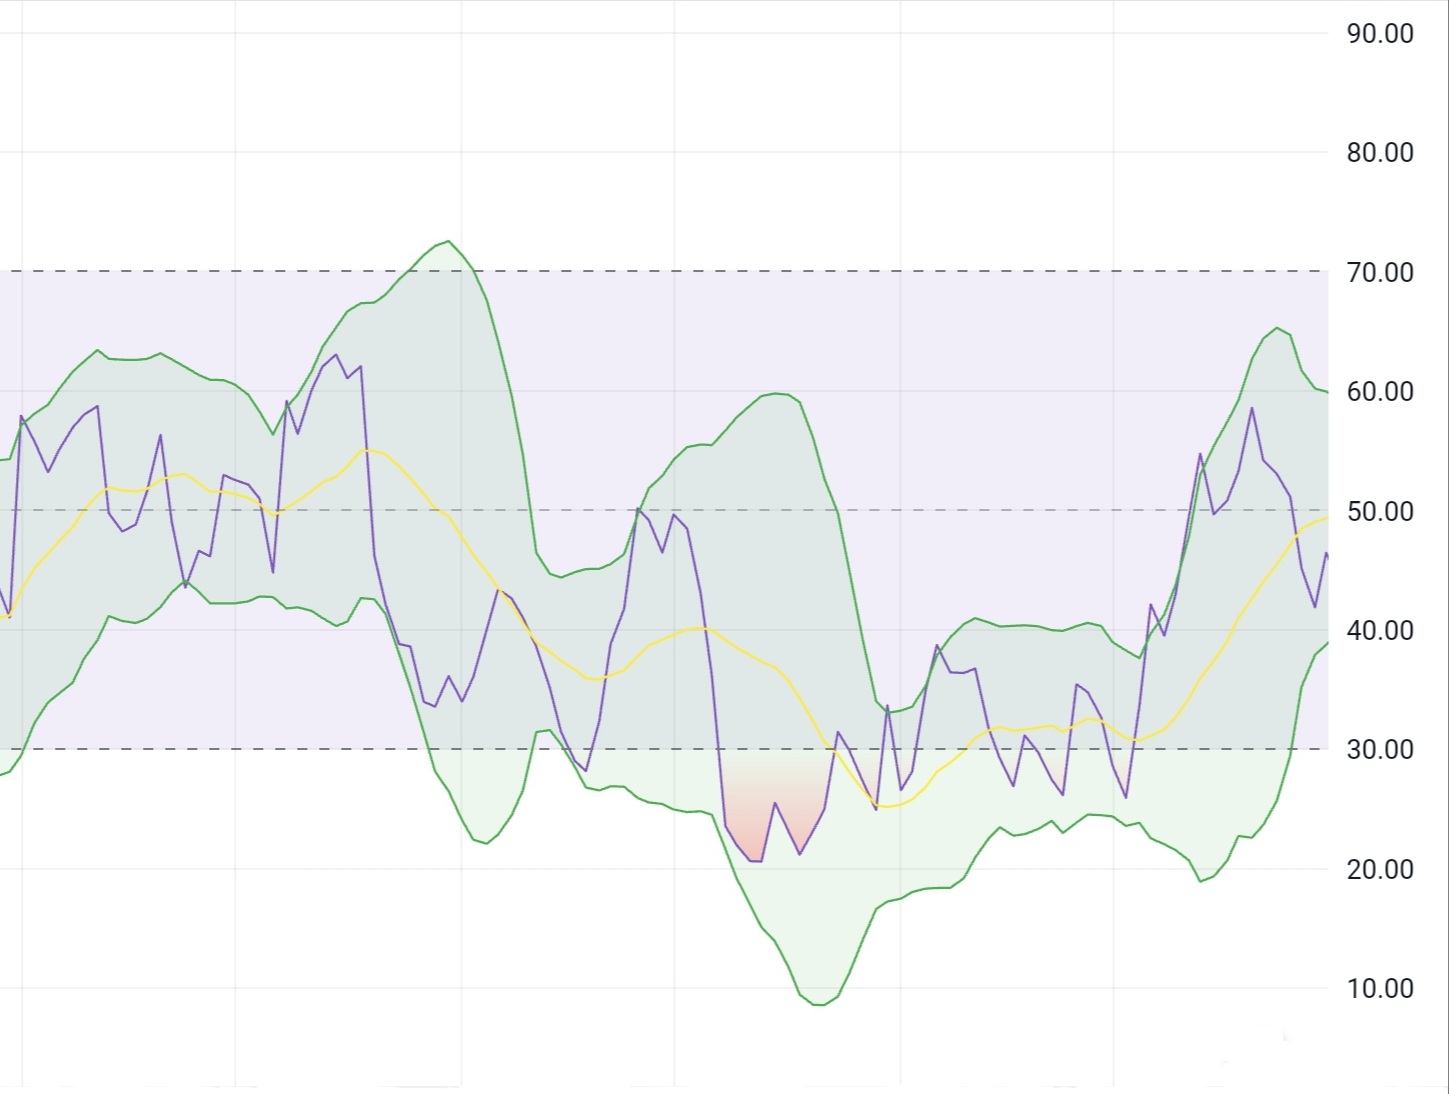
Bollinger Bands on RSI Strategies

While Bollinger Bands are typically applied to price charts to visualize volatility and identify potential price extremes, they can also be overlaid directly on the RSI indicator. Bollinger Bands consist of a middle line (usually a simple moving average of the RSI), an upper band (typically two standard deviations above the middle line), and a lower band (two standard deviations below the middle line). The width of the Bollinger Bands on the RSI chart reflects the volatility of the RSI itself rather than the price volatility.
Entry Signals: When the RSI moves above the upper Bollinger Band on the RSI chart, it suggests that the RSI is overbought, indicating a potential short-term reversal or pullback in price. This could prompt traders to consider selling. Conversely, when the RSI dips below the lower Bollinger Band on the RSI chart, it indicates that the RSI is oversold, implying a potential short-term bounce or reversal in price. This may prompt traders to consider buying.
Exit Signals: There are several possible exit signals in the Bollinger Bands on RSI strategy. You can exit when the RSI crosses the opposite Bollinger Band or the middle line (SMA of RSI). Another approach is setting predefined profit targets or using trailing stops to secure profits. Additionally, you may consider time-based exit rules, closing positions after a certain period.
More sophisticated approach is to use Bollinger %b indicator applied to RSI chart.
RSI and Stochastic Strategy
Combining the RSI and the stochastic oscillator is a popular trading strategy used by many traders. This strategy applies the strengths of both indicators to identify potential entry and exit points in the market.
One common approach is to use both indicators to confirm overbought and oversold conditions. For example, when both the RSI and Stochastic Oscillator signal overbought conditions (RSI above 70 and Stochastic %K line above 80), it may indicate a heightened probability of a price reversal to the downside. Conversely, when both indicators signal oversold conditions (RSI below 30 and Stochastic %K line below 20), it may suggest a potential buying opportunity.
Some traders use crossover signals between the RSI and Stochastic Oscillator lines to trigger trades. For example, a bullish crossover occurs when the %K line of the Stochastic Oscillator crosses above the %D line, while the RSI is in oversold territory, indicating a potential buying opportunity. Conversely, a bearish crossover occurs when the %K line crosses below the %D line, while the RSI is in overbought territory, signaling a potential selling opportunity.
Connors` 2-Period RSI Strategy

The 2-period RSI strategy, developed by Larry Connors, is a well-known and widely discussed trading approach. This strategy is based on the RSI indicator with a period setting of just 2, a departure from the more commonly used 14-period setting.
In Connors’ strategy, overbought conditions occur when the 2-period RSI rises above 90 (or even 95), while oversold conditions occur when the RSI falls below 10 or 5. These extreme levels suggest potential exhaustion in buying or selling pressure, often preceding a reversal in price. Additionally, Connors advises incorporating a filter based on the prevailing trend to reduce false signals and increase trade success. For example, you may only consider buy signals if the overall trend is bullish, indicated by the price trading above 200-day moving average.
Exit signals in this strategy are triggered by the price’s relation to its 5-day SMA. Exit long trades when the price is trading above (yes, exactly “above” since it is a mean reversion strategy) its 5-day SMA, and exit short trades when the price is trading below its 5-day SMA.
You can experiment with different parameters and variations of the strategy, such as adjusting overbought and oversold thresholds or incorporating additional filters. Our backtesting spreadsheets are designed to facilitate these experiments. You can find all the mentioned RSI strategies in our RSI pack of spreadsheets.

Free Backtesting Spreadsheet
Final Thoughts
Mastering RSI strategies requires a deep understanding of technical analysis principles, disciplined execution, and continuous refinement of trading techniques. By incorporating RSI into your trading arsenal and combining it with other tools and methodologies, you can gain a competitive edge in navigating the complexities of financial markets. Remember that successful trading is not about making impulsive decisions based on isolated signals but about following a well-defined strategy with proper risk management and adaptability to market dynamics. As with any skill, proficiency in trading comes with practice, patience, and a commitment to ongoing learning and improvement.
Share on Social Media:


Leave a Reply