Traders are continuously seeking reliable indicators to navigate the complexities of trading. One powerful momentum indicator worth knowing is the Relative Vigor Index (RVI). Created by John Ehlers, the RVI provides insights into market strength and possible reversals, making it useful for traders at any level. In this guide, I will break down how the RVI works, from its calculation to how you can use it in your trading strategies.
Understanding and Calculation of Relative Vigor Index
The Relative Vigor Index is a momentum oscillator that compares the closing price to the trading range over a given period. The RVI is calculated using a complex formula that takes into account multiple data points over a specified period. The numerator calculates the average difference between the closing and opening prices, while the denominator calculates the average trading range. The RVI is then derived by dividing the simple moving average (SMA) of the denominator by the SMA of the numerator over the same period.
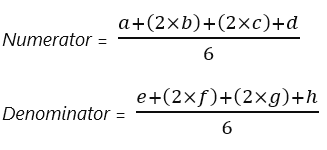
where:
a=Close−Open
b=Close−Open one bar prior to a
c=Close−Open one bar prior to b
d=Close−Open one bar prior to c
e=High−Low of bar a
f=High−Low of bar b
g=High−Low of bar c
h=High−Low of bar d
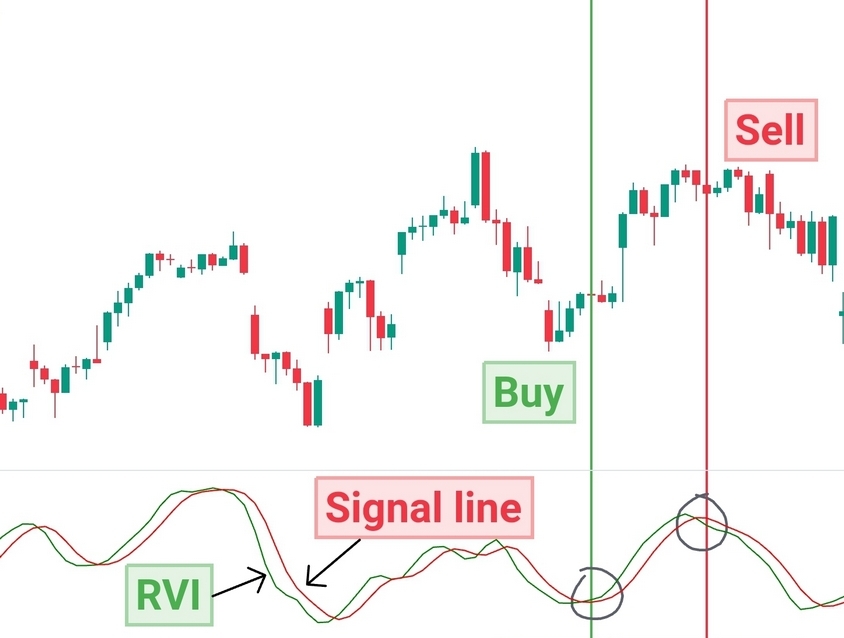
In addition to the RVI line, traders often utilize a signal line to further refine their trading decisions. The signal line is calculated by applying a smoothing function to the RVI line itself. A crossover of the RVI line above the signal line is considered bullish, while a crossover below the signal line is deemed bearish.

where:
i=RVI value one bar prior
j=RVI value one bar prior to i
k=RVI value one bar prior to j
RVI Crossover Strategy
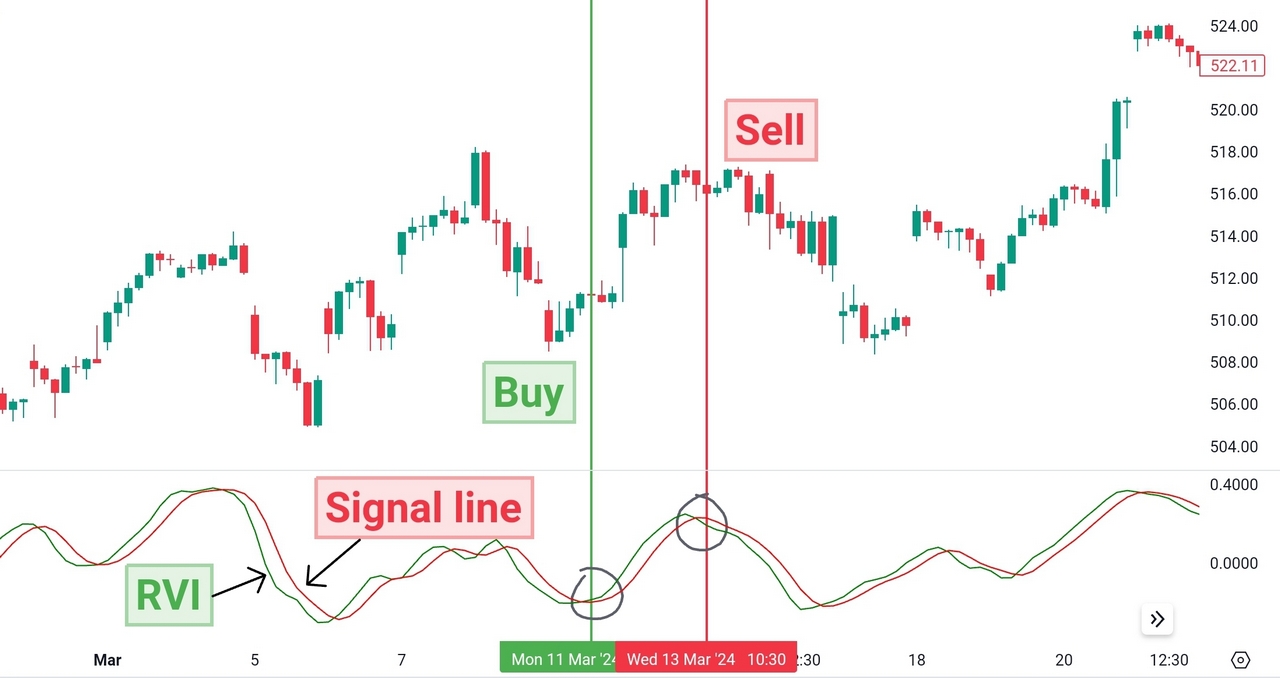
Example of bullish crossovers of RVI line above the signal line. 1h time frame, SPY ETF, TradingView.
The RVI is particularly valuable in identifying periods of heightened momentum within the market. By closely monitoring the magnitude and direction of the RVI line, you can capitalize on momentum-driven price movements. Enter long positions during bullish crossover, when the RVI line surpasses the signal line from below. Conversely, consider short positions during a bearish crossover, when the RVI line falls below the signal line.
RVI Divergence Strategy
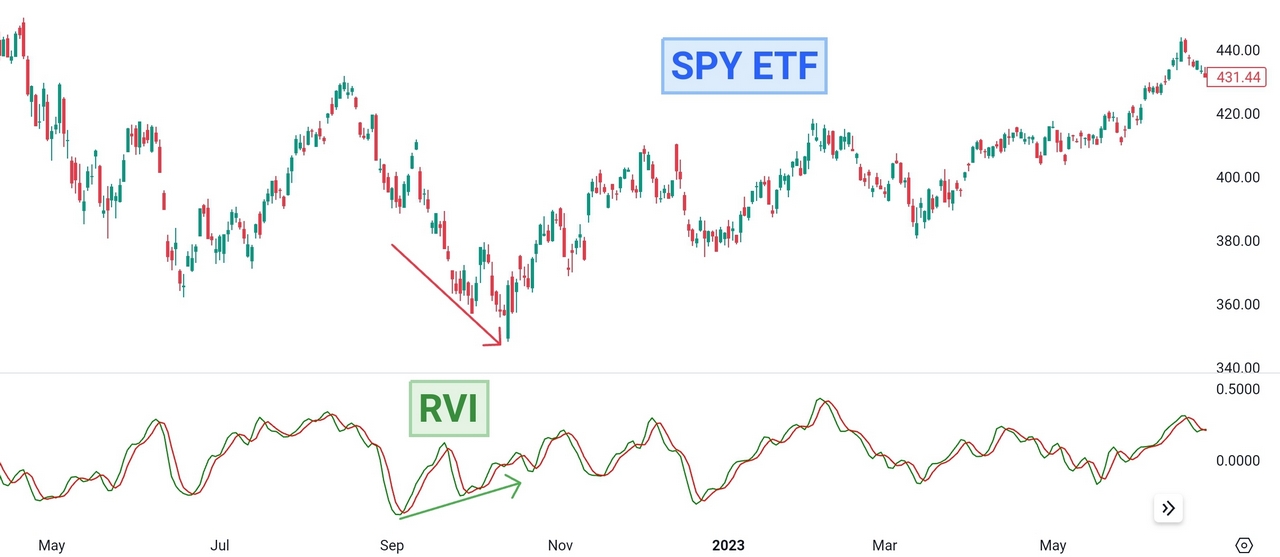
Divergence between price movement and the RVI line. 1D time frame, SPY ETF, TradingView.
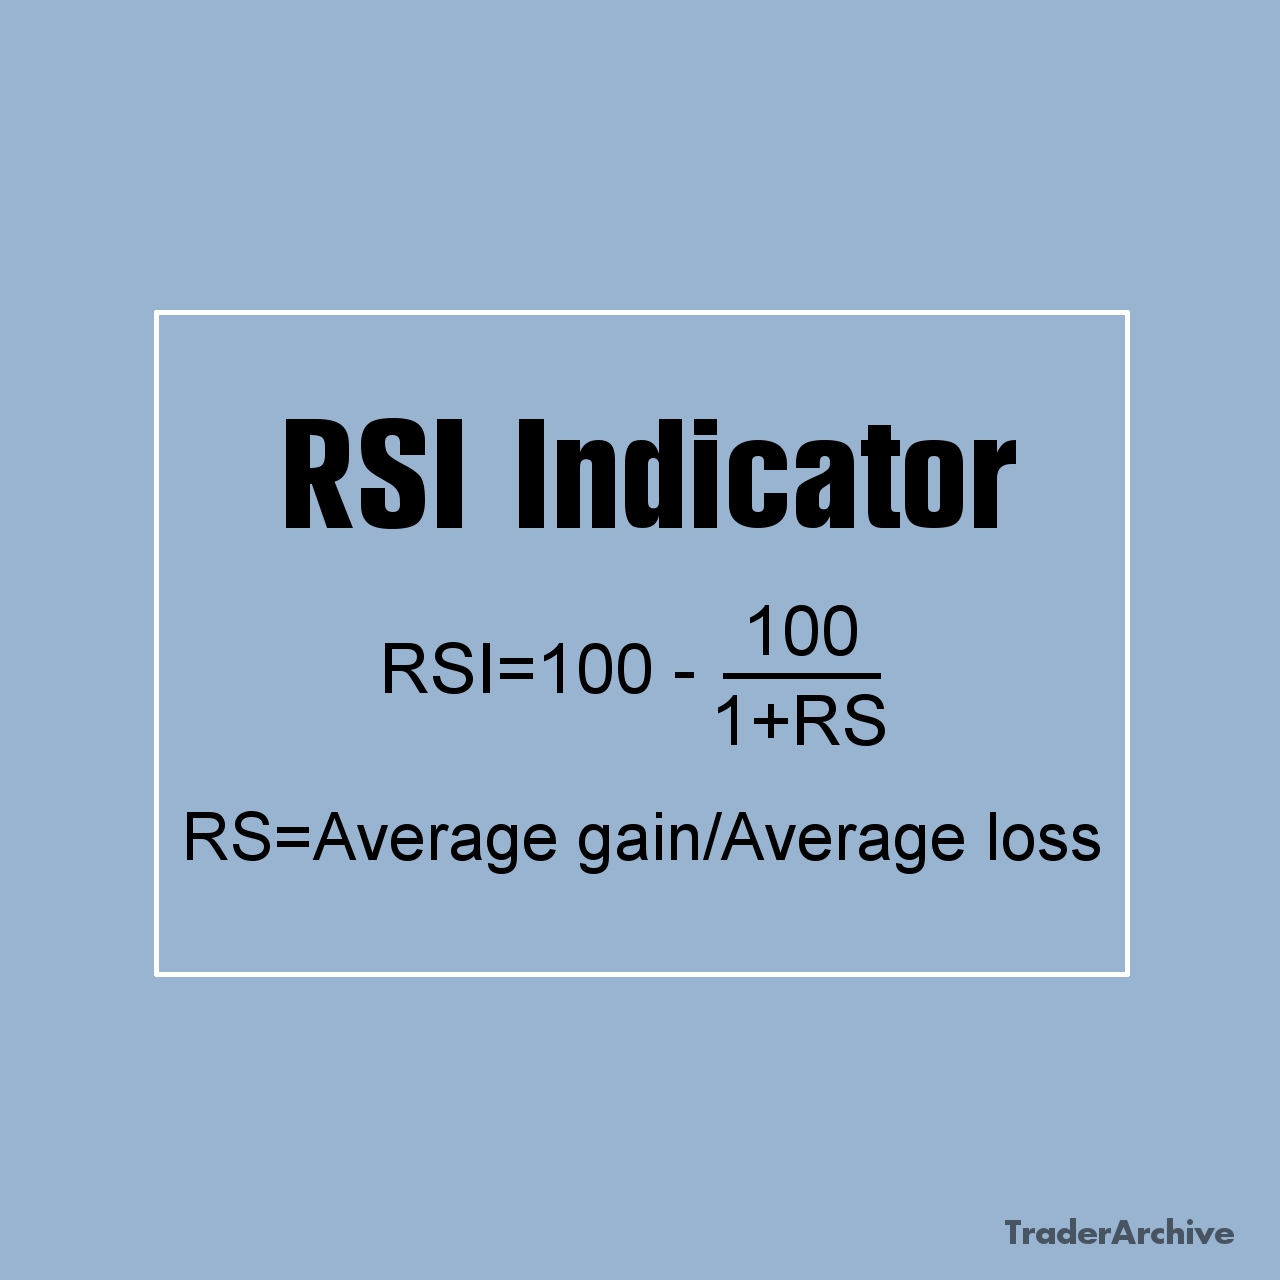
In a similar way like the RSI indicator, the RVI can also serve as a tool for anticipating trend reversals. You can luse divergences between price movements and the RVI line, coupled with overbought or oversold readings, to anticipate potential shifts in market sentiment. Bullish divergence occurs when the price forms lower lows while the RVI forms higher lows, indicating a potential reversal from bearish to bullish sentiment. Conversely, bearish divergence manifests when the price forms higher highs while the RVI forms lower highs, signaling a potential reversal from bullish to bearish sentiment.
Limitations of Relative Vigor Index
The first limitation involves the potential for false signals, which is inherent in all technical indicators, including the RVI. Particularly in choppy or range-bound markets, you should exercise caution and supplement RVI signals with additional analysis to confirm their validity. Additionally, the effectiveness of the RVI can be influenced by various parameters, such as the look-back period and the smoothing factor for the signal line. You need to conduct thorough backtesting and optimization to identify the optimal RVI settings for your specific trading strategy.
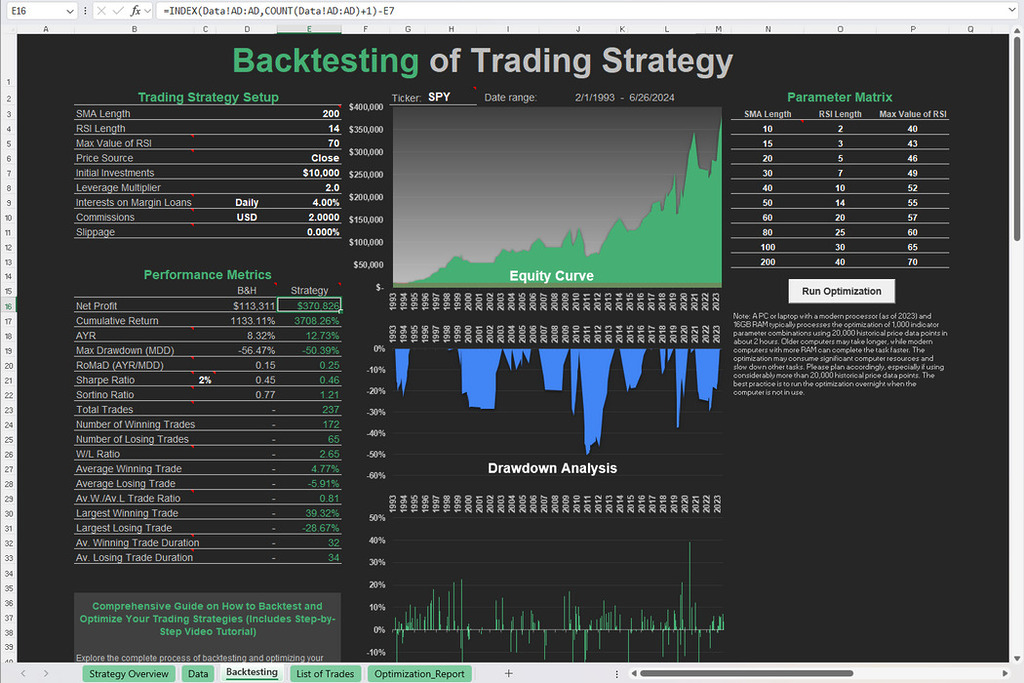
Free Backtesting Spreadsheet
Backtesting with Historical Data and Excel Spreadsheet
Backtesting is a crucial step in evaluating the effectiveness of any trading strategy, including those involving the relative vigor index. By backtesting with historical data, you can assess the performance of your RVI-based strategies under various market conditions. Here’s how you can conduct backtesting using historical data and an Excel spreadsheet.
Historical Data Collection
Begin the backtesting process by acquiring historical price data for the specific financial instrument you intend to trade. Historical price data typically encompasses the opening, high, low, and closing prices for each trading period, which could be daily or intraday depending on your preference and the frequency of your trading strategy.
To gather this data, you can utilize various sources, including financial websites, trading platforms, data providers, or APIs (Application Programming Interfaces) that offer historical price data for the desired asset. You can start with Investing.com which provides free historical data in 1D time frame. Ensure that the dataset covers a sufficiently extensive time horizon to encompass various market conditions and price movements.
Calculation of RVI and Signal Line in Excel Spreadsheet
Once you have assembled the historical price data, the next step involves computing the relative vigor index and signal line values for each trading period in your dataset. To perform these calculations in Excel, input opening, high, low, and closing prices into separate columns within your spreadsheet. Then, apply the formulas provided earlier in this guide to compute the RVI and signal line values for each trading period.
For the RVI calculation, determine the average difference between the closing and opening prices (the numerator) and the average trading range (the denominator) over the specified period. Finally, derive the RVI by dividing the SMA of the numerator by the SMA of the denominator. Similarly, compute the signal line by applying a smoothing function to the RVI values. You can download Excel template for RVI indicator which was created for your convenience.
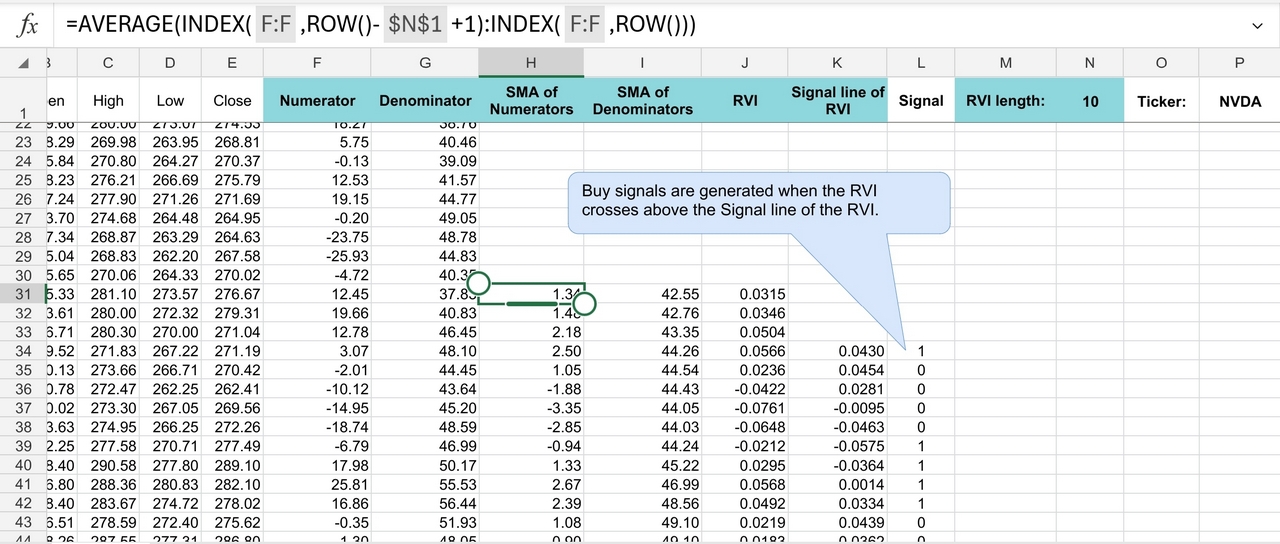
RVI calculation with Excel
Once you have calculated the RVI and signal line values, identify trading signals based on strategies described earlier in this guide. Record these signals in your spreadsheet, marking whether they correspond to bullish or bearish indications.
Next, simulate trades based on the generated signals to assess their profitability. For each signal, determine the entry and exit points, as well as the size of the position (e.g., number of shares or contracts). Calculate the resulting profit or loss for each simulated trade.
Analyze the performance of your RVI-based trading strategy by examining key metrics such as the total number of trades, win rate, average profit per trade, maximum drawdown, and overall profitability. Compare these metrics to benchmark values and assess the strategy’s consistency and robustness.
If necessary, refine your trading strategy by adjusting parameters such as the look-back period for the RVI calculation or the threshold levels for identifying signals. Conduct additional backtesting iterations to evaluate the impact of these changes on performance.
Final Thoughts
The relative vigor index is a handy tool for spotting market strength and potential reversals. By learning how it’s calculated and applied in trading, you can use the RVI to make better decisions. But, like any indicator, it works best when combined with other tools and smart risk management. Backtesting with historical data, especially using Excel, can give you a clearer idea of how well your RVI-based strategies perform. With ongoing testing, fine-tuning, and optimization, you can improve your trading approach and boost your chances of long-term success.
Share on Social Media:
FAQ About Relative Vigor Index
What is the difference between RSI and RVI?
The RSI measures the magnitude of recent price changes to determine whether a security is overbought or oversold, based solely on price movements. In contrast, the RVI compares the closing price to the trading range, assessing the strength of price movements.
What is the best setting for relative vigor index?
The optimal setting for the Relative Vigor Index (RVI) may vary depending on various factors, including the trading timeframe, market conditions, and individual preferences. However, a common setting for the RVI is 10 periods. Traders may experiment with different look-back periods but it’s essential to conduct thorough backtesting and optimization to identify the most suitable parameters for your specific trading strategy.
Is the relative vigor index (RVI) a leading indicator?
The relative vigor index (RVI) is classified as a leading indicator in technical analysis. This means it aims to predict future price movements by analyzing current market conditions.

Leave a Reply