Moving averages are among the most widely used technical indicators in the world of trading. They offer invaluable insights into the market trends, help traders identify potential entry and exit points, and provide a framework for developing profitable trading strategies. This article aims to cover most used moving average strategies, exploring different types of moving average indicators and optimization technique for maximizing their effectiveness.
Understanding Moving Averages
Moving averages are statistical calculations used to analyze data points by creating a constantly updated average price. They smooth out price fluctuations, making it easier to identify trends and reversals. While simple moving average (SMA), exponential moving average (EMA), and weighted moving average (WMA) are the most known types, there are also other moving averages that traders utilize to gain deeper insights into market trends and dynamics.
Simple Moving Average (SMA)
The simple moving average (SMA) stands as the foundational form of moving averages in technical analysis. It’s calculated by summing up a set of prices over a specific period, such as days or hours, and then dividing it by the number of periods. This calculation method results in a straightforward average that offers a clear indication of the general direction of the trend. However, due to its equal weighting of all data points, the SMA may exhibit a lag behind the latest price movements. Despite this limitation, SMA remains a widely used tool in analyzing market trends and is often employed as a component in more complex trading strategies.
Exponential Moving Average (EMA)
The exponential moving average (EMA) represents an advancement over the SMA, addressing its lagging issue by giving more weight to recent price data. This increased emphasis on recent prices enables the EMA to be more responsive to current market conditions. As a result, the EMA reacts swiftly to price changes, making it particularly suitable for capturing short-term trends and momentum shifts. Short-term traders and trend followers favor the EMA due to its ability to provide timely signals and reduce the impact of outdated price data on trend analysis.
Weighted Moving Average (WMA)
The weighted moving average (WMA) introduces a nuanced approach to moving averages by assigning different weights to each data point. Unlike the SMA and EMA, which apply different weighting methodologies, the WMA specifically emphasizes recent prices by assigning them higher weights. This weighting mechanism allows the WMA to strike a balance between the simplicity of the SMA and the responsiveness of the EMA. Consequently, the WMA produces smoother curves compared to the SMA while still being sensitive to price changes. Although less commonly used than the SMA and EMA, the WMA can offer valuable insights into market trends and dynamics, particularly in certain trading strategies where an emphasis on recent price movements is critical.
Hull Moving Average (HMA)
The Hull moving average is a refined moving average that aims to reduce lag while improving smoothing. It accomplishes this by utilizing a weighted average of three different EMAs, thereby achieving smoother curves compared to traditional moving averages. The HMA adjusts its sensitivity based on market volatility, making it particularly useful in fast-moving markets. Traders often use the HMA to identify trend reversals and trade with the prevailing market momentum.

Free Backtesting Spreadsheet
Adaptive Moving Average (AMA)
The adaptive moving average is a unique moving average that adjusts its sensitivity based on market conditions. Unlike traditional moving averages, which use fixed parameters, the AMA dynamically changes its period length in response to changes in price volatility. During periods of high volatility, the AMA shortens its period to capture fast price movements, while during low volatility periods, it lengthens its period to filter out noise. This adaptability makes the AMA effective in various market conditions and helps traders identify trends with greater accuracy.
Arnaud Legoux Moving Average (ALMA)
The Arnaud Legoux moving average is a sophisticated moving average designed to reduce lag while maintaining smoothness. It achieves this by incorporating a Gaussian distribution into its calculation, resulting in a moving average that responds quickly to price changes without sacrificing accuracy. The ALMA is particularly effective in capturing short to medium-term trends and is favored by traders who seek to enter and exit positions with precision. Its unique formula makes it less susceptible to whipsaws during volatile market conditions, enhancing its reliability as a trend-following indicator.
Double Exponential Moving Average (DEMA)
DEMA represents a refinement of the EMA by incorporating a double smoothing technique. Unlike the standard EMA, which applies a single level of smoothing to the price data, DEMA takes the EMA of the EMA, resulting in an even faster and more responsive moving average. This double smoothing process effectively reduces lag further, making DEMA particularly attractive to traders. By incorporating two levels of exponential smoothing, DEMA provides a more accurate representation of recent price action.
Triangular Moving Average (TMA)
TMA is a lesser-known variant of the moving average that utilizes a triangular weighting scheme to calculate the average price. TMA places greater emphasis on prices in the middle of the data series while gradually decreasing the weight for prices further from the center. This triangular weighting scheme results in a smoother and more responsive moving average that is particularly effective at capturing trends and filtering out noise. While TMA may not be as widely used as other moving averages, it can offer unique insights into market trends, especially in certain trading strategies where emphasis on central prices is beneficial.
Moving Average Strategies

Single moving average strategy produces many false signals. NVDA stock prices and 200-periods EMA/TradingView
A typical moving average strategy involves interpreting price movements in relation to a moving average. When the price is above the moving average, it suggests a bullish trend, and traders may look for buying opportunities. Conversely, when the price is below the moving average, it indicates a bearish trend, and traders may consider selling or shorting opportunities. This strategy is straightforward and suitable for traders looking for simple trend-following signals. However, it may produce many false signals during ranging or choppy market conditions. That’s why traders have developed a variety of different approaches to capitalize on market movements.
Moving Average Crossover Strategy

This strategy employs two moving averages with different periods, typically a short-term moving average (e.g., 50 periods) and a long-term moving average (e.g., 200 periods). When the short-term moving average crosses above the long-term moving average, it generates a bullish signal, indicating a potential uptrend. Conversely, when the short-term moving average crosses below the long-term moving average, it produces a bearish signal, signaling a potential downtrend. This strategy is popular among traders seeking to capture medium to long-term trends in the market.

Variation of a dual moving average crossover strategy.
There is a variation of a dual moving average crossover strategy. Long positions are closed out when prices cross below either moving average (or cross above for short positions), indicating a potential reversal or weakening of the uptrend (or downtrend). This approach adds a twist to the traditional dual moving average crossover strategy, incorporating elements of both trend-following and mean reversion strategies. It can be considered a hybrid strategy that aims to capture both sustained trends and capitalize on mean reversion opportunities.
Exponential Moving Average Ribbon

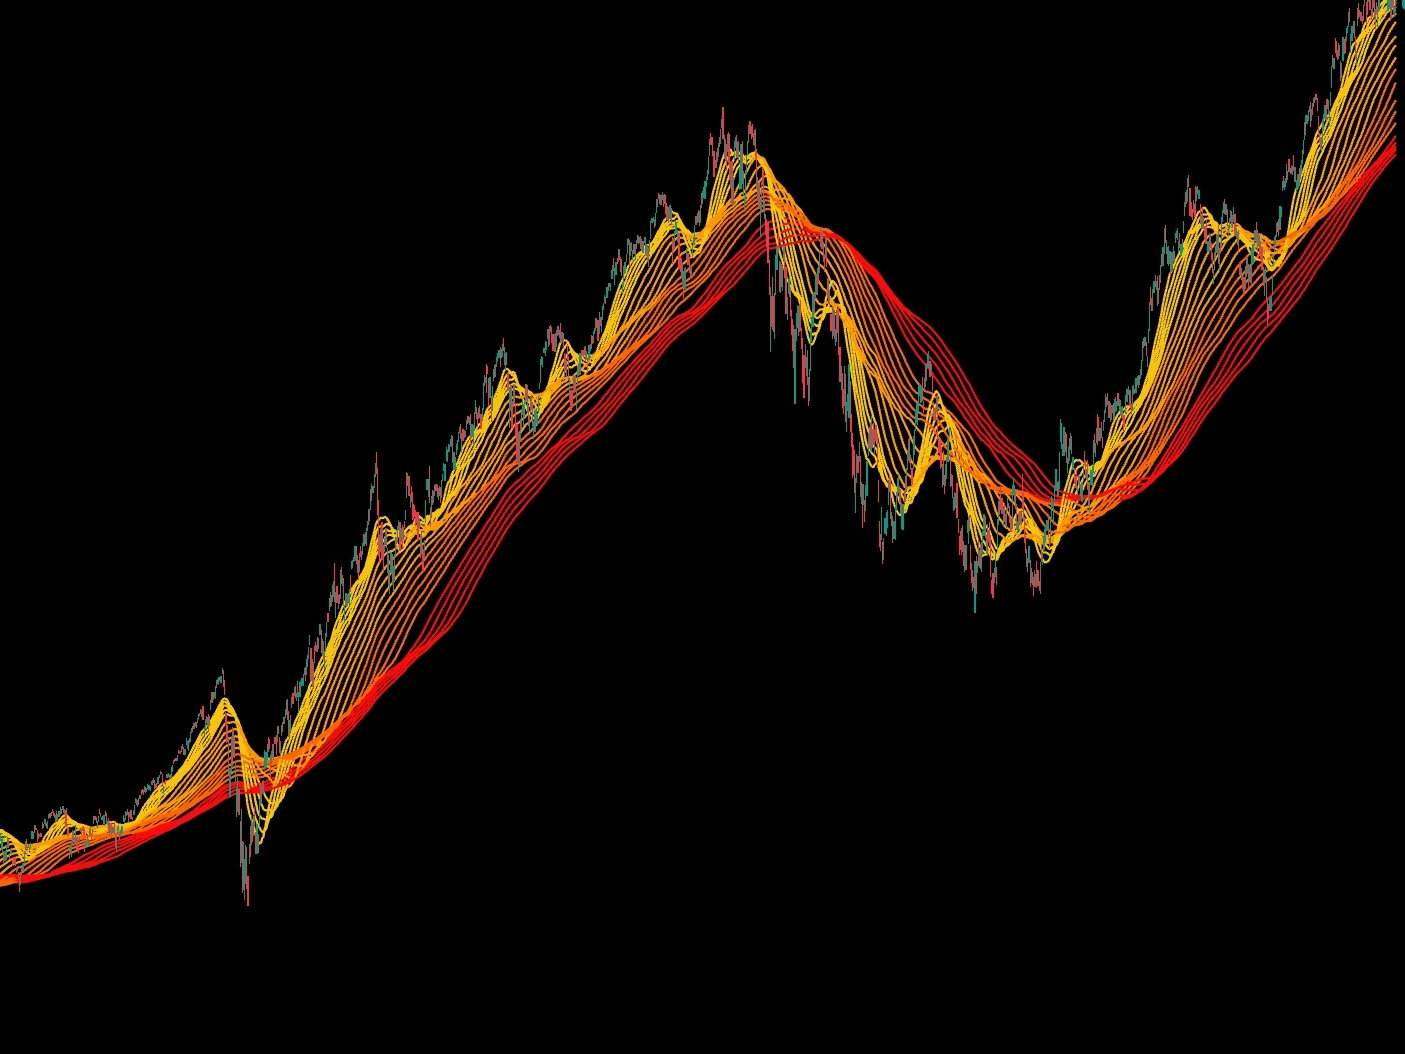
The QQQ ETF price chart with 20, 25, 30, 35, 40, 45, 50, 60, 70, 80, 90, 100, 120, 140, 160, 180, 200-periods EMAs/TradingView
The exponential moving average ribbon strategy involves plotting multiple EMAs of varying periods on the price chart. In an uptrend, EMAs of shorter periods are positioned above EMAs of longer periods, forming a ribbon-like structure above the price. This alignment suggests a strong uptrend. Conversely, in a downtrend, EMAs of shorter periods are positioned below longer-period EMAs, forming a ribbon below the price, indicating a downtrend. The EMA ribbon strategy is favored by traders seeking to visually assess the strength and direction of trends across different timeframes.
The EMA ribbon strategy does not provide explicit buy or sell signals like other moving average strategies. Instead, it offers a visual representation of trend direction and strength, enabling traders to make informed decisions based on their interpretation of the chart patterns. Traders often combine the EMA ribbon strategy with other technical indicators or price action analysis to confirm their trading signals and manage risk effectively.
Moving Average Convergence Divergence (MACD) Strategy

NVDA stock prices and MACD (12,26)/TradingView
MACD is a versatile trend-following momentum indicator derived from the difference between two EMAs and a signal line. When the MACD line crosses above the signal line, it generates a bullish signal, suggesting a potential buying opportunity. This crossover indicates increasing bullish momentum in the market. Conversely, when the MACD line crosses below the signal line, it produces a bearish signal, indicating a potential selling opportunity. While this strategy is popular among traders seeking to identify changes in momentum and trend direction, it is just one of many approaches that utilize the MACD indicator. See complete list of MACD strategies.
Moving Average Envelope Strategy

Moving average envelopes consist of two parallel lines placed above and below a moving average. These envelopes help traders identify overbought and oversold conditions in the market. When prices touch the upper envelope, it suggests an overbought condition, potentially signaling a selling opportunity as prices may revert to the mean. Conversely, when prices touch the lower envelope, it indicates an oversold condition, potentially signaling a buying opportunity as prices may bounce back. This strategy is popular among traders seeking to capitalize on mean reversion and market extremes.
Optimization Techniques for Moving Average Strategies
Optimizing moving average parameters is a crucial aspect of developing effective trading strategies. By fine-tuning the periods of moving averages, traders can adapt their strategies to different market conditions and timeframes, enhancing their chances of success. Here are some optimization techniques commonly used by traders:
- Historical Data Analysis: Traders often analyze historical price data to identify periods in which specific moving average combinations have performed well. By backtesting various combinations of moving average periods on historical data, traders can assess their effectiveness in capturing trends and filtering out noise. This involves examining past price movements to determine which moving average parameters have provided the most reliable signals in similar market conditions.
- Walk-Forward Analysis: Walk-forward analysis involves dividing historical data into multiple segments, with each segment consisting of an in-sample period for parameter optimization and an out-of-sample period for validation. Traders optimize moving average parameters on the in-sample data and then validate the optimized parameters on the out-of-sample data to assess their robustness. This technique helps ensure that the optimized parameters are not overfitted to specific historical periods and are capable of performing well in unseen market conditions.
- Parameter Sensitivity Analysis: Traders should conduct sensitivity analyses to assess how changes in moving average parameters affect trading performance. By varying the parameters within a certain range and observing the corresponding changes in performance metrics, traders can gain insights into the robustness and stability of their strategies. This involves systematically adjusting the moving average periods and observing the impact on key performance metrics such as profitability, drawdowns, and win rates. Sensitivity analysis helps traders understand the range of parameter values that produce optimal results and identify potential weaknesses in their strategies.
Final Thoughts
Incorporating moving average strategies into your trading approach requires careful consideration of market conditions, risk management, and trade execution. While moving averages can provide valuable insights into market trends and potential entry and exit points, they are most effective when used as part of a comprehensive trading plan. By mastering moving average strategies and adapting them to suit your trading style and objectives, you can enhance your trading performance and navigate the dynamic landscape of financial markets with confidence.
Share on Social Media:
FAQ
What is a moving average?
A moving average is a statistical tool used in trading to smooth out price data over time and identify trends.
How do moving averages help in trading?
Moving averages make it easier to spot trends by reducing noise and highlighting the overall direction of the market.
What are the different types of moving averages?
The two main types are the simple moving average (SMA) and the exponential moving average (EMA), with EMA giving more weight to recent data.
How do traders use moving averages in their strategies?
Traders use moving averages to identify trend changes, with strategies like crossover signals and using them as dynamic support and resistance levels.
Are there any limitations to using moving average strategies?
Moving averages can lag sudden price movements and may produce false signals in choppy markets, so it’s essential to use them alongside other indicators and risk management techniques.


Leave a Reply