When you start trading, it’s natural to focus on gains, imagining profits growing and compounding. But experienced traders know that understanding and preparing for losses is just as crucial. One key measure that keeps you grounded is the maximum drawdown. In this article, you’ll learn what maximum drawdown really means, how to calculate it in Excel, and why it’s essential in backtesting to get a clear picture of a strategy’s risk.
What Is Maximum Drawdown?
Maximum drawdown is a measure of the largest loss a strategy or portfolio experiences from a peak to a low. Imagine it as the deepest dip in your account balance over a specific period. Drawdown tells us how much money you could lose before the portfolio bounces back, and maximum drawdown is just the worst of these dips. It’s a key risk metric that every trader watches because it tells you how much you could lose if your strategy hits a rough patch.
Calculating Maximum Drawdown in Excel
Calculating maximum drawdown in Excel is pretty simple. You only need right formula for this. I`ll give you two options. The first option uses just one magic formula, but it’s a bit resource-intensive, especially with large datasets. The second option is easier on resources but requires a few steps.
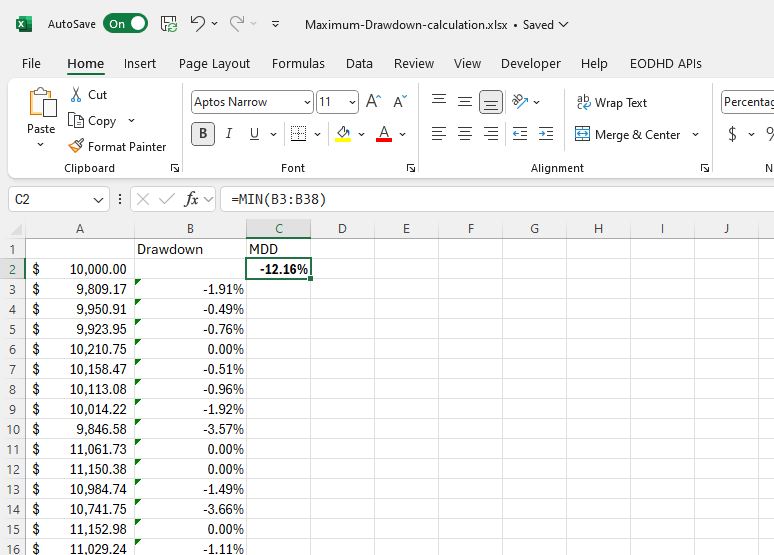
Let’s start with the magic formula. Here it is: =MIN((A3-MAX($A$2:A3))/MAX($A$2:A3),0)
This formula assumes that your portfolio values are in column A starting from the cell A2. Copy this formula down and calculate maximum drawdown in specific cell as shown in this picture:
For larger datasets, this formula might slow things down during recalculations. A good alternative is to use a helper column to store the running maximum. Here’s how:
- In a helper column (say, column B), calculate the running maximum with the formula: =MAX($A$2:A3). Copy this down.
- Now, in column C (or wherever you’d like), use a simpler formula to calculate the drawdown: =MIN((A3-B3)/B3,0)
- Like before, find the minimum value from this column to determine your maximum drawdown.
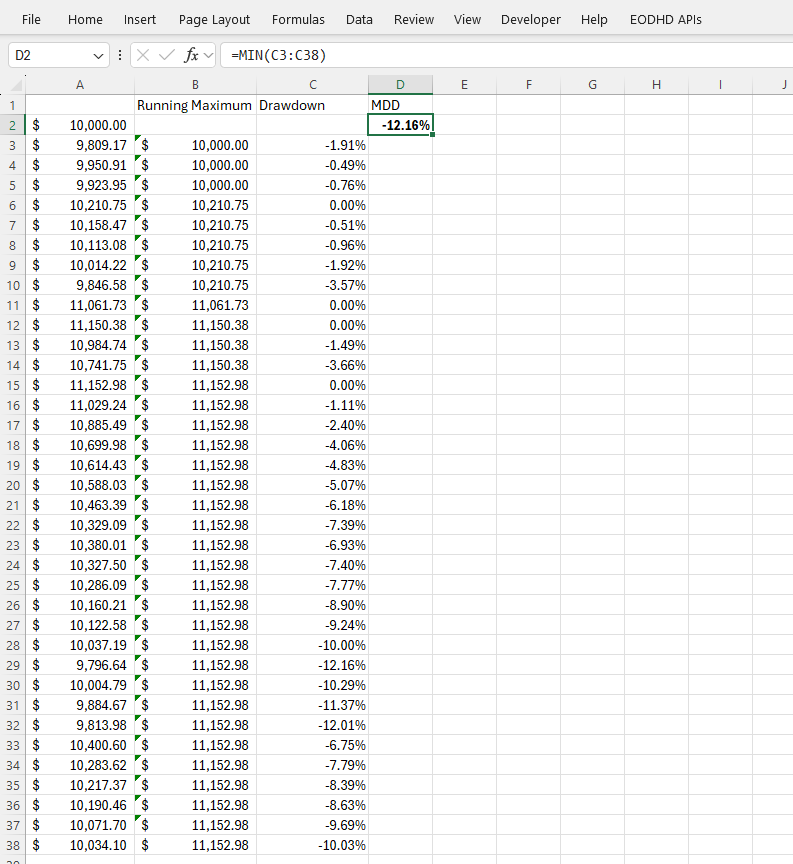
Real examples often make things easier to understand – download this sample spreadsheet and check all the formulas and calculations.
Backtest to Predict Your Maximum Drawdown!
Backtesting is the best way to see how deep your strategy’s losses might go. Think of it as a trial run, using historical data to see what kinds of drawdowns you might face. By testing your strategy on past data, you can get a realistic view of potential drawdowns.
For backtesting results to be meaningful, a minimum of 200 trades is often considered a statistically significant sample size. This reduces the impact of random fluctuations and focuses on consistent results. In day trading, however, where trades happen more frequently, you’ll likely need an even larger sample. Your testing period should cover a full market cycle, including bull, bear, and sideways markets. This approach prepares you for every possible scenario your strategy might encounter.
What Is the Limit for Maximum Drawdown?
Understanding Your Psychology and Tolerance
You might read online that a 20% max drawdown is a “gold standard” for traders. But there’s no universal number that works for everyone. It’s more about your own mental readiness. Imagine the worst loss you could face—the kind that might make you want to abandon your strategy. Try to pinpoint that breaking point where you can still stay calm and keep trading.
This is why it’s important to look within and understand your personal limit. By analyzing your strategy’s backtest results, you can notice that robust strategies recover after a significant drawdown. That is why your confidence in used strategy is key! This confidence comes from serious backtesting and validation, long before any deep drawdown hits. Testing over as much historical data as possible is the best way to build that confidence. Be sure to include out-of-sample data and consider adding a buffer — extra drawdown points to your expected maximum drawdown — to account for scenarios that haven’t yet occurred but could in the future.
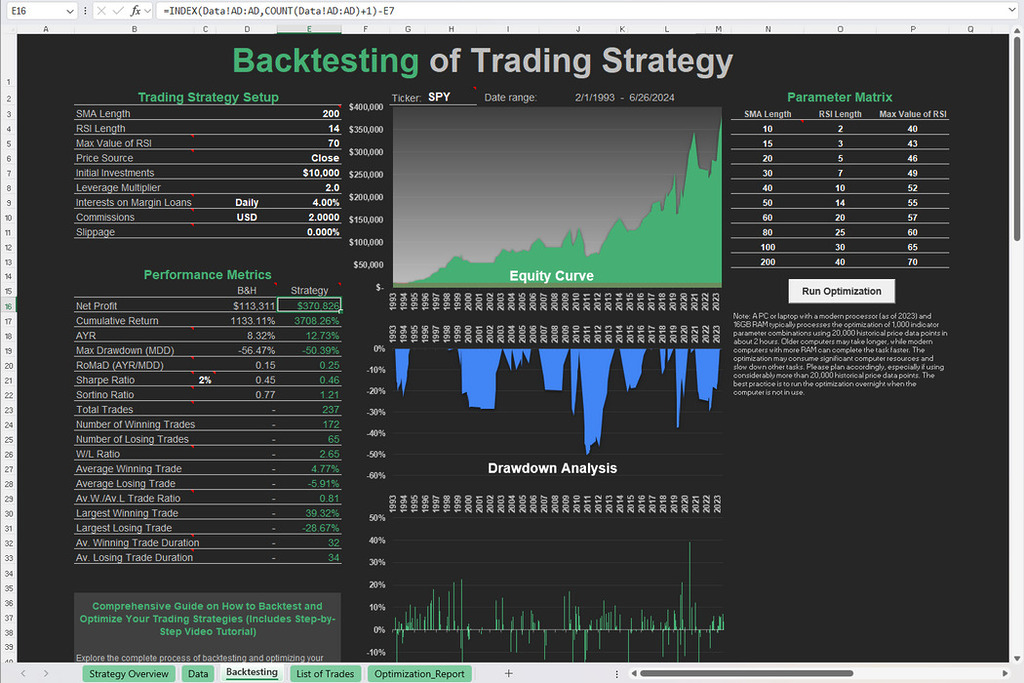
Free Backtesting Spreadsheet
Return Over Maximum Drawdown (RoMaD)
When you’re thinking about maximum drawdown, remember to check the return you’re getting in exchange for that risk. This is where the Return over Maximum Drawdown (RoMaD) ratio comes in. RoMaD helps you understand if the return justifies the risk. The higher the ratio, the better your return relative to the biggest loss you might face.
What Drawdowns Institutional Traders Have?
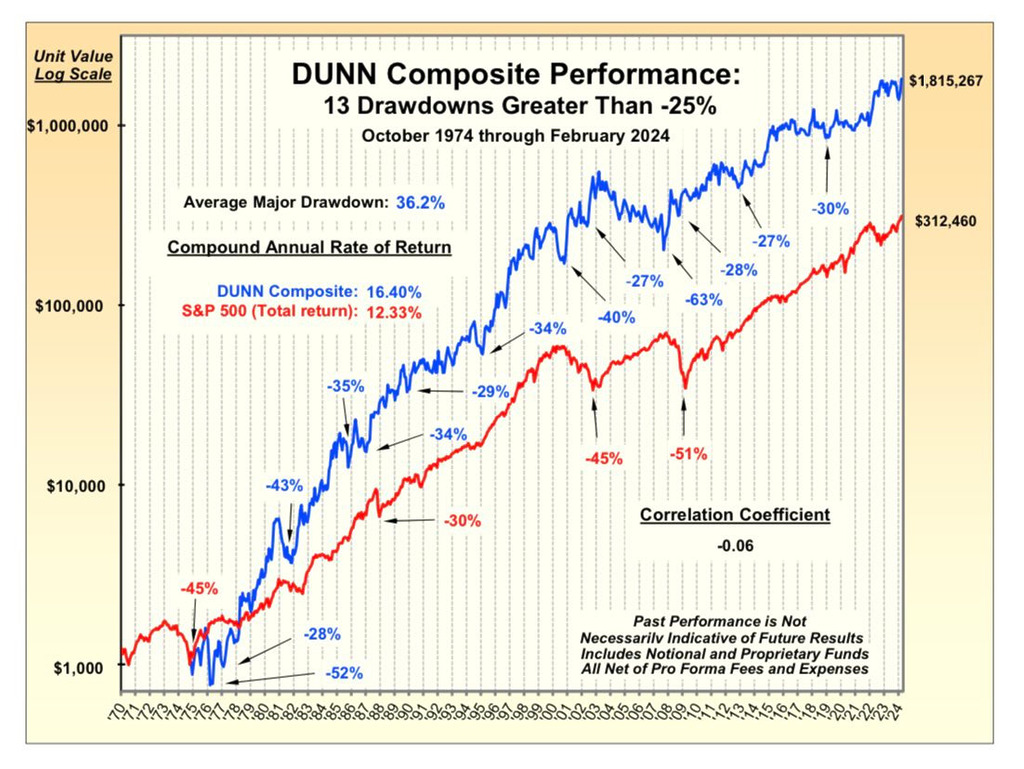
While every trader has their own acceptable level of maximum drawdown, as an individual trader, you’re likely curious about some standard for this value. How institutional traders, with all their resources, manage their strategies to reduce drawdowns, and to what levels? This information can give you a benchmark to gauge your own success in managing drawdowns. Here is one prominent example – DUNN Composite Performance.
Source: https://x.com/Covel
As you can see from the image above, DUNN Capital, with their fully systematic approach, has experienced many deep drawdowns over the last 40 years, some even exceeding 50% and 60%. Despite these significant drawdowns, they’ve consistently outperformed the S&P 500 index, with long-term returns of 16.4%. Their RoMaD ratio is 0.26.
So, if you achieve similar results in your own trading, you can consider yourself a successful individual trader — especially given that you have fewer resources than institutional traders.
Duration of Drawdown: It’s More Than Just the Size
Not only the value of the maximum drawdown is important, but also how long it takes to recover. This recovery period, or drawdown duration, affects you psychologically. It’s one thing to lose money quickly and recover quickly. But it’s much tougher to endure losses over an extended period.
The longer the drawdown, the harder it can be to keep faith in your strategy, as doubts start to creep in. Long drawdowns can also lower the Sharpe ratio, a measure of risk-adjusted return, because they increase the volatility of your returns. When backtesting a trading strategy, keep an eye on the Sharpe ratio. A low Sharpe ratio can signal that drawdowns are likely to be prolonged.
If the Sharpe ratio doesn’t give you enough insight and you’d like to calculate the exact duration of your maximum drawdowns, let’s move on to the next chapter.
How to Calculate Maximum Drawdown Duration in Excel
Let`s take spreadsheet which we used for the calculation of maximum drawdown, including dates for each drawdown period.
- In a helper column, use an IF formula to indicate when a drawdown is happening. In cell F2, enter: =IF(D2<0,1,0). This formula will display 1 when you’re in a drawdown (portfolio value is below the peak) and 0 when the portfolio is at or above the peak.
- In Column G, track the start date of each drawdown period. When the drawdown starts, record the date; otherwise, carry forward the last start date or leave it blank. In G2, use: =IF(AND(F2=1, F1=0), A2, IF(F2=1, G1, “”)) Copy this formula down.
- In Column H, calculate the duration of each drawdown period in days. In H2, enter: =IF(AND(F2=0, F1=1), A2-INDEX(G:G, MATCH(1,F:F,0)), ) This formula calculates the duration in days by subtracting the start date (in Column G) from the end date of each drawdown, displaying only on the day the drawdown ends.
- Use the MAX function on Column H to get the longest drawdown duration: =MAX(H:H)
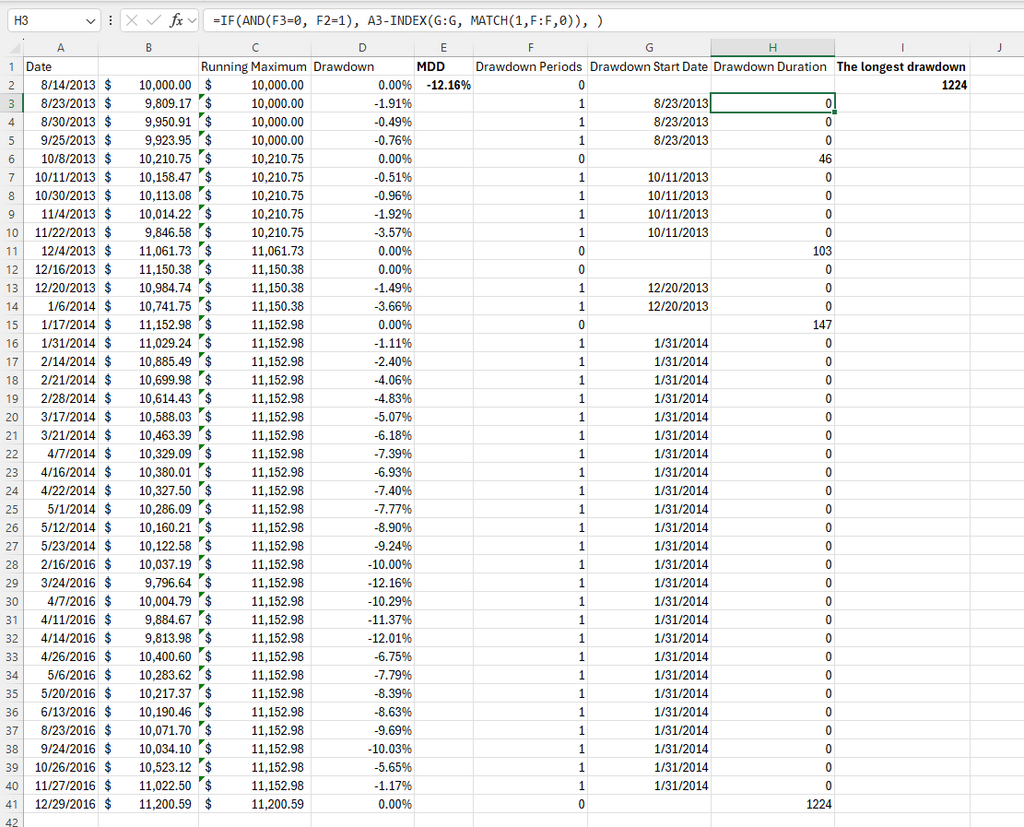
Calculate the Duration of the Maximum Drawdown
Often, the maximum drawdown coincides with the longest drawdown, but this isn’t always the case. To calculate the duration specifically for the maximum drawdown, go through these steps:
- In a helper column, enter 0% in I2 cell, and in I3 cell use: =IF(H2>0, D3, IF(D3<I2, D3, I2)) Copy this formula down.
- Extract drawdown durations and corresponding maximum values using the FILTER function. In cell J3, enter: =FILTER(H3:H41, H3:H41>0)
- Find the duration of the maximum drawdown. In cell L2, use: =INDEX(J:J, MATCH(E2, K:K, 0))
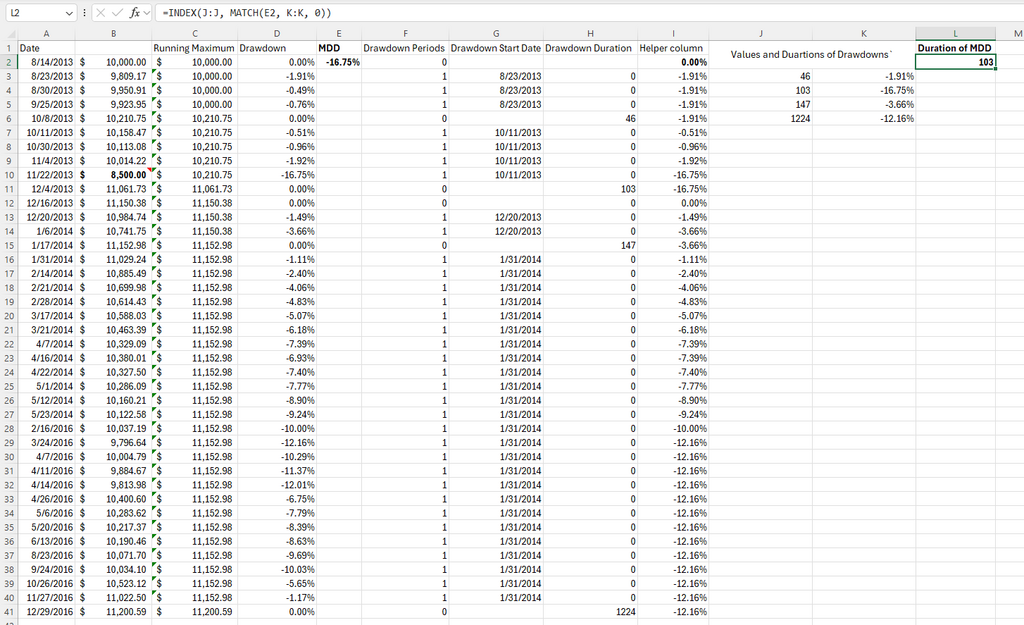
You can download this sample spreadsheet to explore all formulas and calculations.
How to Prepare Yourself for a Deep Drawdown
Backtesting is your best tool here. Even paper trading has limits because deep drawdowns don’t happen often, so you might miss them while testing in simulation mode. Backtesting with as much historical data as possible gives you a clear view of how your strategy might perform in different conditions. I’d like to stress that you should use out-of-sample data to evaluate potential maximum drawdowns to avoid the overfitting trap.
If you are not confident in your strategy before you start trading, you will doubt it even more when a deep drawdown hits. I remember my first time facing this situation. I was pretty casual about preparation and backtesting — I didn’t want to spend $200 on historical data that had an extra 10 years of data. But when my account hit a -$2000 drawdown, doubts started rising. I finally bought the data, ran the test, and found my strategy’s actual maximum drawdown was closer to 30% instead of the 15% I had seen with less data. This $2000 loss wasn’t even the worst that could happen, and those extra 10 years showed the strategy may took too long to recover from drawdowns. If I had known all this before, I wouldn’t have even started with that strategy.
The one smart thing I did back then was only trade a small part of my portfolio. That brings me to the next tip.
Don’t Trade a Lot of Money with a New Strategy
Even after solid backtesting and forward testing, it is best to ease into trading a new strategy. Start small and gradually increase your portfolio exposure as you gain confidence in it. If your plan is to trade a strategy for 10 years or more, it’s no big deal to trade it for a year or two with just part of your portfolio and without leverage. During this time, you will likely discover new insights and ways to evaluate your new strategy. This gradual approach helps you avoid emotional attachment and lets you focus on understanding the real edge of this strategy.
Final Thoughts
Understanding maximum drawdown isn’t just about crunching numbers—it’s about preparing yourself mentally and financially for the ups and downs of trading. Knowing how deep your strategy might dip helps you stay calm and stick to your plan when things get rough. Make backtesting a key part of your routine and treat it like your safety net. Remember, you don’t have to go all-in right away; trade small at first until you feel confident in your approach. With careful planning and realistic expectations, you’ll be better equipped to deal with the market and avoid letting a tough drawdown shake your confidence.
Share on Social Media:
FAQ
What is the meaning of maximum drawdown?
Maximum drawdown shows the biggest drop in value a portfolio or strategy has had from a high point to a low point. It helps you see the worst loss you could face before it recovers.
What is a good max drawdown?
A “good” max drawdown depends on your risk tolerance and strategy, but many traders aim for around 10-20%. Some traders may accept deeper drawdowns if their long-term returns are high enough.
How do you calculate the max drawdown?
To calculate max drawdown, compare each portfolio peak to the lowest point that follows it. Use this formula: (Current Value - Peak Value)/(Peak Value). Repeat this for each peak to find the biggest percentage drop.
What is the maximum drawdown amount?
The maximum drawdown amount is the largest dollar or percentage loss from a peak to a low point. It’s the most you would have lost during the worst period.
What is the 5% drawdown rule?
The 5% drawdown rule limits individual losses to 5% of the account value. If losses hit 5%, you stop trading or adjust your strategy to protect your capital.

Leave a Reply