The Moving Average Convergence Divergence (MACD) is one of the most popular and versatile indicators used by traders across various financial markets. Developed by Gerald Appel in the late 1970s, MACD is a momentum oscillator that shows the relationship between two moving averages of an asset’s price. Over the years, traders have developed numerous MACD strategies to identify potential trend reversals, momentum shifts, and entry/exit points. I will cover 6 popular MACD strategies explaining their strengths and weaknesses.
MACD Indicator Components
MACD Line: The MACD line is calculated by subtracting the 26-period Exponential Moving Average (EMA) from the 12-period EMA. It represents the difference between short-term and long-term price trends.
Signal Line: The Signal Line is a 9-period EMA of the MACD line. It often acts as a trigger for buying and selling signals.
MACD Histogram: The MACD Histogram represents the difference between the MACD line and the Signal line. It helps to visualize the momentum of a trend.
In fact, the MACD indicator provides alternative way to visualize the interaction between fast and slow moving averages.
Read the dedicated article on the MACD indicator for more details and calculation methods.
#1. MACD Crossover Strategy

EUR/USD price chart with the MACD indicator/TradingView
The MACD crossover strategy is a trend following strategy and one of the simplest and most widely used MACD strategies. It involves identifying bullish and bearish signals generated by the crossover between the MACD line and the Signal line.
Bullish Signal: A bullish signal occurs when the MACD line crosses above the signal line, indicating a potential upward trend reversal or strengthening momentum. This is a signal to buy or enter a long position.
Bearish Signal: Conversely, a bearish signal occurs when the MACD line crosses below the signal line, suggesting a potential downward trend reversal or weakening momentum. Sell or enter a short position.
While the MACD crossover strategy is straightforward, false signals can occur during ranging or choppy market conditions. You can use additional confirmation indicators or combine the MACD crossover strategy with other technical analysis tools (see section “MACD RSI strategy” below).
#2. Zero-Line Crossovers

EUR/USD daily price chart.
In addition to the traditional MACD crossover signals, you can also monitor zero-line crossovers as an alternative signal for your trading strategy. The zero-line, also known as the equilibrium or center line, represents the point of equilibrium between bullish and bearish momentum. Note that this is the same as a crossover of fast and slow moving averages. If you find these signals helpful, you don’t actually need to use the MACD indicator — just use an EMA crossover strategy instead.
Bullish Zero Line Crossover: When the MACD line crosses above the zero line, it reflects a shift from bearish to bullish momentum. It’s equivalent to a fast EMA crossing above a slow EMA. This often marks the start of new uptrends or confirms existing bullish trends.
Bearish Zero Line Crossover: Conversely, when the MACD line crosses below the zero line, it signals a shift from bullish to bearish momentum. This can suggest the beginning of new downtrends or confirm ongoing bearish trends. As with the bullish crossover, a fast EMA crossing below a slow EMA will show the same signal.
#3. MACD Divergence Strategy

EUR/USD daily price divergence with the MACD line.
MACD divergence occurs when the price of an asset moves in the opposite direction of the MACD indicator. This divergence suggests a potential reversal in the current trend. There are two types of MACD divergence:
Bullish Divergence: Bullish divergence occurs when the price forms lower lows, but the MACD indicator forms higher lows. It indicates weakening bearish momentum and a potential bullish reversal.
Bearish Divergence: Bearish divergence occurs when the price forms higher highs, but the MACD indicator forms lower highs. It suggests weakening bullish momentum and a potential bearish reversal.
#4. MACD Histogram Strategy
The MACD histogram strategy focuses specifically on changes in histogram bars of the MACD indicator.
Bullish Signal: Rising histogram bars indicate a strengthening momentum in the current trend. This is a bullish signal and can be considered as an opportune moment to enter a long position.

Free Backtesting Spreadsheet
Bearish Signal: Conversely, falling histogram bars suggest a weakening momentum in the current trend. You can interpret this as a bearish signal and consider exiting your long position or even consider reversing your position.
The problem with this strategy is that the MACD histogram tends to generate many false signals. To address this, you can adjust the MACD’s settings to longer periods; for example, changing the standard 12- and 26-period settings to 24- and 50-periods, respectively. Adjusting the signal line length may also help. Backtesting these settings on historical data can reveal if they improve signal reliability.
#5. MACD RSI Strategy

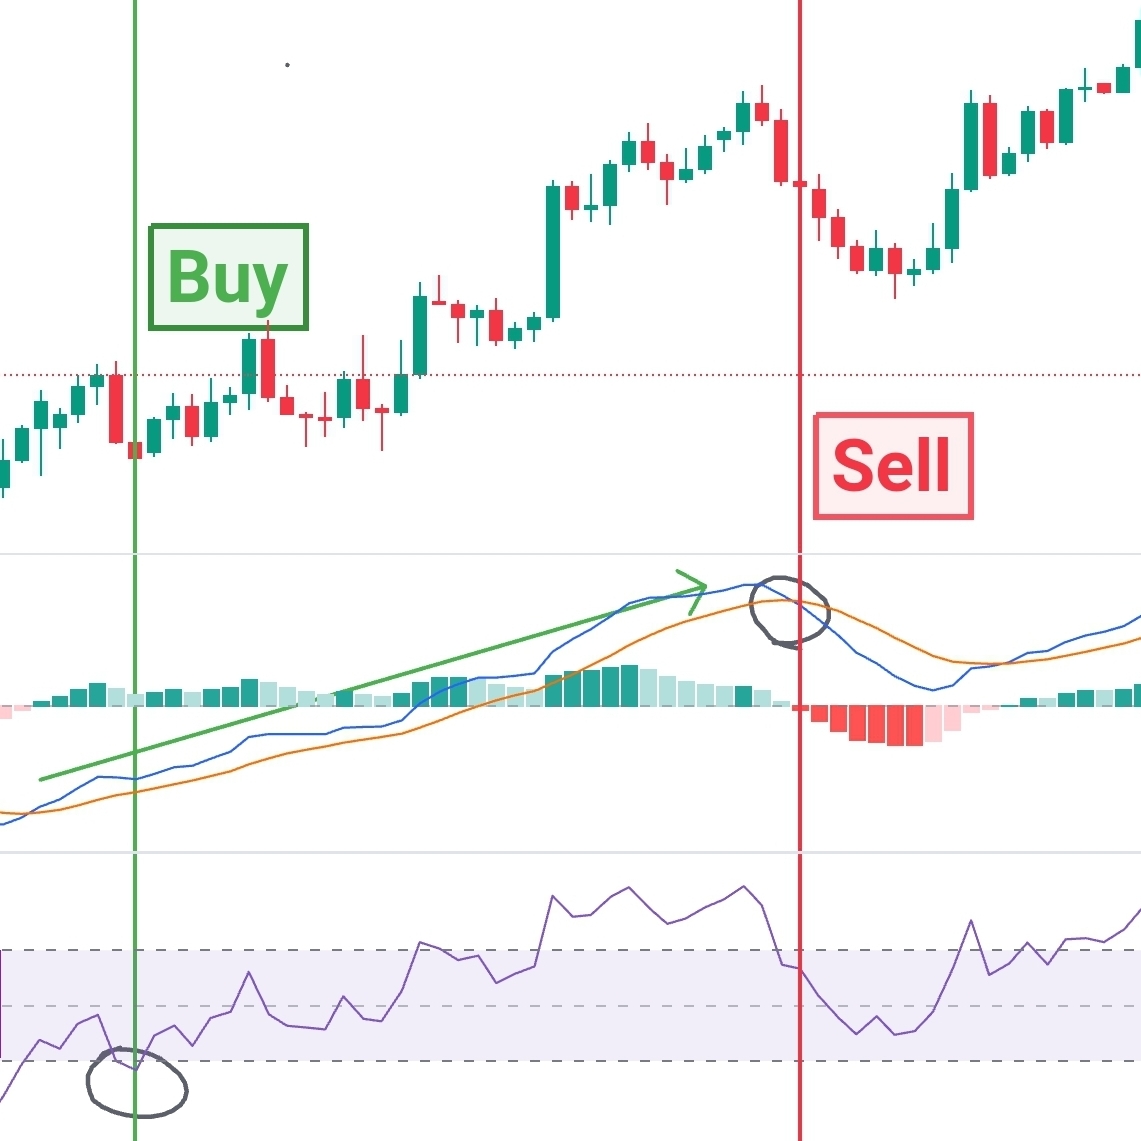
EUR/USD daily price chart with MACD and RSI indicators.
The MACD RSI strategy typically involves using the MACD indicator to identify the direction and strength of the trend, while the RSI indicator is used to assess overbought or oversold conditions within that trend. By combining these two indicators, you can filter out false signals and increase the probability of successful trades.
Traders first use the MACD indicator to determine the direction of the trend. When the MACD line is above the signal line, it indicates an uptrend, while a MACD line below the signal line suggests a downtrend. Once the trend direction is identified, traders use the RSI indicator (often in a shorter time frame) to assess whether the market is overbought or oversold within that trend. The RSI ranges from 0 to 100, with readings above 70 considered overbought and readings below 30 considered oversold (often even 60 and 40 readings are considered as overbought and oversold, respectively).
Getting the right settings for the MACD and RSI indicators can make a big difference with this strategy. Tweaking these parameters to match your trading style and the market conditions you’re in can help you get more reliable signals. No strategy is perfect, but experimenting with different settings can help you make the MACD RSI strategy work better for you.
#6. MACD & 200 EMA Strategy

200-period EMA serves as a trend filter. EUR/USD daily price chart.
In the MACD & 200 EMA strategy, the 200-period EMA acts as a trend filter to help identify the overall trend, while the MACD provides momentum signals as usual.
Entry Signals: Once the trend is set using the 200 EMA, you can use the MACD to spot potential entries that align with the trend. In an uptrend (price above the 200 EMA), look for bullish signs like the MACD line crossing above the signal line or zero-line crossovers for long positions. In a downtrend (price below the 200 EMA), bearish signs, such as the MACD line crossing below the signal line or zero-line crossovers, can signal short positions.
Exit Signals: Exits can vary — you can choose between MACD crossovers, divergence patterns, or price action signals. Another option is to exit when the price crosses back above or below the 200 EMA.
Experimenting with MACD settings based on your market and trading style can be helpful. Backtesting and tweaking these parameters can show how well the strategy performs and reveal opportunities to refine it further.
Which Strategy to Choose?
Each MACD strategy can give great insights into market trends, but using them randomly on any instrument can lead to mixed signals. This happens because each strategy is designed for specific market conditions. For example, the MACD crossover strategy might work well in trending markets but could throw out false signals in choppy or sideways conditions. On the other hand, the MACD divergence strategy is good at spotting trend reversals, but it might not be as effective in strongly trending markets.
Importance of Backtesting and Parameter Optimization
To determine the most suitable MACD strategy for a given instrument or market, proceed with thorough backtesting and optimization. Backtesting involves analyzing historical data to evaluate the performance of each strategy under various market conditions. Through backtesting can help to identify the strengths and weaknesses of each strategy.
Moreover, optimizing the parameters of MACD indicators, such as the number of periods for the short and long moving averages or signal line, can further enhance the effectiveness of each strategy. By fine-tuning the parameters based on historical performance, you can adjust the strategies to suit the specific characteristics of the instrument traded.
Final Thoughts
MACD strategies are a great set of tools for spotting trends, identifying possible reversals, and making smart trading decisions. Whether you use them on their own or alongside other technical analysis tools, MACD strategies can give you valuable insights into how the market works. These strategies can help you boost profits while keeping risks in check. Just remember, no strategy is a sure thing, so it’s super important to practice good risk management for long-term success.
Share on Social Media:
FAQ
What is the best strategy for MACD?
There isn’t a one-size-fits-all answer to this question as the best MACD strategy depends on various factors including market conditions, trading style, and risk tolerance. Some traders prefer the MACD crossover strategy for trend following, while others may find success with the MACD divergence strategy for identifying trend reversals.
What is the MACD 5-minute strategy?
The MACD 5-minute strategy is a short-term trading approach that utilizes the MACD indicator on a 5-minute chart to identify quick trading opportunities and often involves EMA trend filter on daily timeframe. It typically involves looking for MACD line crossovers, zero-line crossovers, or divergences on the 5-minute chart to generate trading signals.
What is the MACD daily strategy?
The MACD daily strategy is a longer-term trading approach that involves using the MACD indicator on a daily chart to identify trends and potential entry/exit points. The MACD daily strategy may involve looking for MACD line crossovers, divergence patterns, or zero-line crossovers on the daily chart to confirm trading signals.
What is the MACD 0-line strategy?
The MACD 0-line strategy, also known as the zero-line crossover strategy, focuses on the relationship between the MACD line and the zero-line (center line). Traders watch for instances when the MACD line crosses above (bullish) or below (bearish) the zero-line to identify shifts in market momentum.
How accurate is MACD strategy?
The accuracy of the MACD strategy can vary depending on market conditions, asset class, and the specific parameters and strategies employed. While MACD can provide valuable insights into market trends and momentum, it may generate false signals, especially during choppy or range-bound markets. Backtesting with historical data can help assess the performance and reliability of MACD strategies over time.


Leave a Reply