In the vast landscape of financial markets, traders continuously seek tools and indicators to guide their decisions, striving to uncover patterns and trends within the data deluge. One such tool that has gained significant attention is the Keltner Channel. Originally introduced by Chester Keltner in the 1960s, the Keltner Channel is a powerful technical analysis tool used by traders to identify potential trends, reversals, and breakouts in the market. This article aims to explore construction, interpretation, and practical applications of the Keltner Channel. Furthermore, it will elucidate the process of backtesting Keltner channel strategies using Excel, offering traders valuable insights into refining their trading methodologies.
Understanding the Keltner Channel
The Keltner Channel, a volatility-based indicator, comprises three lines plotted around an exponential moving average (EMA). Originally conceived by Chester Keltner, the indicator featured a simple moving average (SMA) as the middle line and derived the upper and lower channels from the average of high, low, and close prices. Today, the Keltner Channel’s fundamental components are structured as follows:
- Middle Line (EMA): The middle line of the Keltner Channel is typically a 20-period EMA. This line serves as the baseline and represents the underlying trend in price movement.
- Upper Channel Line: The upper channel line is derived by adding a multiple of the average true range (ATR) to the middle line. The ATR measures market volatility over a specified period (typically a 10-period). Common multiples used to calculate the upper channel line range from 1.5 to 2 times the ATR above the EMA.
- Lower Channel Line: Like the upper channel line, the lower channel line is calculated by subtracting a multiple of the ATR from the middle line. This creates a channel below the EMA that encapsulates price movements.
 formula.")
 formula.")

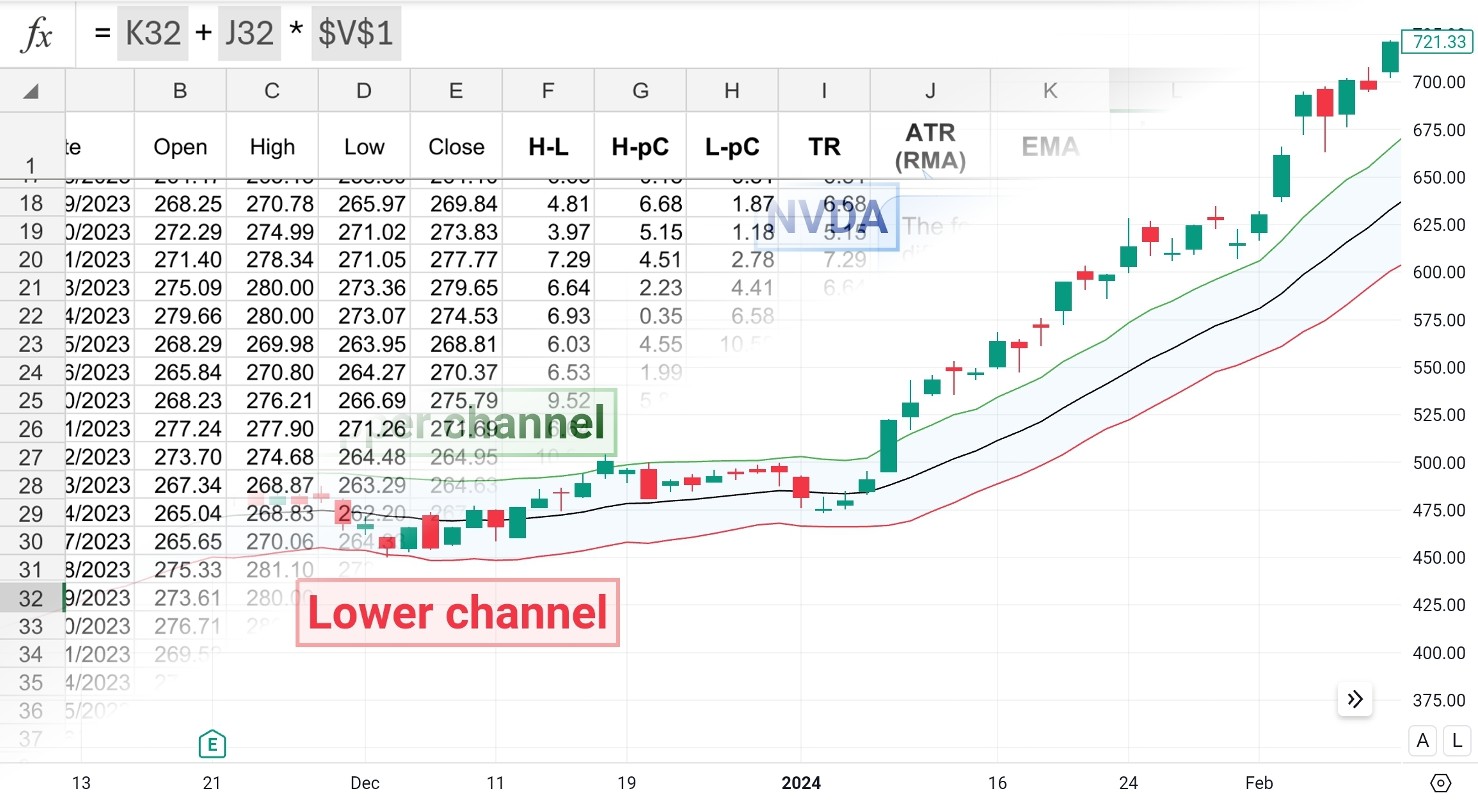
The Keltner channel on NVDA price chart/TradingView
The Keltner Channel in Trading Strategies
The versatility of the Keltner Channel lends itself to a wide range of trading strategies across different timeframes and asset classes. Here are some popular approaches employed by traders:
- Trend Following: Utilizing the Keltner Channel in conjunction with other trend-following indicators, such as the Moving Average Convergence Divergence (MACD) or the Relative Strength Index (RSI), traders aim to ride established trends while minimizing false signals.
- Mean Reversion: Contrarian traders often employ the Keltner Channel to identify extreme price movements that deviate significantly from the mean. By waiting for prices to revert back within the channel boundaries, traders seek to capitalize on short-term reversals.
- Range Trading: In sideways or consolidating markets, the Keltner Channel can serve as dynamic support and resistance levels. Traders look to buy near the lower channel line and sell near the upper channel line, profiting from price oscillations within the range.
- Volatility Breakout: High-volatility environments present lucrative opportunities for breakout traders. By waiting for prices to breach the outer boundaries of the Keltner Channel with conviction, traders seek to capitalize on rapid price movements driven by increased volatility.
Limitations and Considerations
While the Keltner Channel is a powerful tool for technical analysis, traders should be aware of its limitations and exercise caution when interpreting signals:
- Whipsaws: Like any technical indicator, the Keltner Channel is not immune to generating false signals, especially during periods of low volatility or choppy price action. Traders should use additional filters or confirmation tools to validate signals and reduce the risk of whipsaws.
- Optimization: The effectiveness of the Keltner Channel parameters (e.g., EMA period, ATR multiplier) may vary depending on the market conditions and timeframe. Traders should conduct thorough testing and optimization to determine the most suitable parameters for their trading style.
- Market Environment: The Keltner Channel performs best in trending markets where price movements exhibit clear directionality. In choppy or range-bound markets, the channel may produce less reliable signals, leading to potential losses if not used in conjunction with other indicators or filters.
Keltner Channel vs Bollinger Bands
The Keltner Channel utilizes the concept of exponential moving averages (EMA) and the Average True Range (ATR) to construct dynamic price channels, with the central line determined by the EMA. The upper and lower boundaries are derived by adding and subtracting multiples of the ATR from the EMA, respectively. In contrast, Bollinger Bands consist of a central moving average line (typically a simple moving average) and two outer bands that are calculated based on standard deviations from the moving average. The width of the Bollinger Bands adjusts dynamically based on the volatility of the underlying asset, expanding during periods of increased volatility and contracting during calmer market conditions. You can opt for the smoother dynamics of the Keltner Channel or use the volatility-based approach of Bollinger Bands.

Free Backtesting Spreadsheet
Risk Management Considerations
While the Keltner Channel provides valuable insights into market dynamics, prudent risk management is essential to safeguard capital. Here are some key considerations for managing risk when trading with the Keltner Channel:
- Position Sizing: Determine appropriate position sizes based on the width of the Keltner Channel and your risk tolerance. Avoid overleveraging, especially during periods of heightened volatility.
- Stop Loss Placement: Place stop-loss orders strategically to limit potential losses in the event of adverse price movements. Consider placing stops beyond significant support or resistance levels to allow for minor fluctuations within the channel.
- Trade Confirmation: Use additional technical or fundamental analysis tools to confirm signals generated by the Keltner Channel. Avoid relying solely on the indicator and incorporate multiple sources of information into your trading decisions.
- Adaptability: Market conditions are constantly evolving, necessitating flexibility in your trading approach. Periodically reassess the effectiveness of your strategy and adjust your parameters accordingly to adapt to changing market dynamics.
Backtesting The Keltner Channel Strategies with Historical Data Using Excel
Incorporating the Keltner Channel into your trading arsenal requires thorough testing and validation to ensure its efficacy across various market conditions. One effective method for evaluating trading strategies is backtesting, which involves analyzing historical data to assess the performance of a given strategy. Backtesting allows traders to gauge the robustness of their strategies, identify potential flaws, and refine their approach before risking real capital in live trading. Let’s explore how you can conduct backtesting using historical data and Excel spreadsheets.
Data Collection and Preparation
The first step in backtesting is to gather historical price data for the asset you intend to trade. This data typically includes daily open, high, low, and close prices, along with volume data if available. Many financial websites and data providers offer downloadable historical data in spreadsheet-friendly formats like CSV (comma-separated values) or Excel. You can start with Investing.com which provides free historical data in 1D time frame.
Once you’ve obtained the historical data, organize it into a spreadsheet, with each row representing a specific date and each column containing relevant price and volume information. Ensure that the data is clean and free from errors or missing values before proceeding to the next step.
Strategy Formulation
Define the trading strategy you wish to backtest using the Keltner Channel. This could involve a simple trend-following approach, mean reversion strategy, or breakout trading strategy, as discussed in earlier sections. Specify the entry and exit criteria based on Keltner Channel signals, such as buying when prices cross above the upper channel line and selling when prices fall below the lower channel line.
Implementing the Strategy in Excel
Create formulas in your Excel spreadsheet to calculate the Keltner Channel lines based on the historical price data. You can download Excel template for the Keltner Channel indicator which was created for your convenience.

Next, implement the entry and exit rules based on Keltner Channel signals. For example, if the closing price crosses above the upper channel line, mark a buy signal, and if it crosses below the lower channel line, mark a sell signal. Keep track of the trading positions (long or short) and calculate the corresponding profits or losses for each trade.
Performance Evaluation and Analysis
Once you’ve implemented the trading strategy in Excel, assess its performance using various metrics, such as the total number of trades, win rate, average profit per trade, maximum drawdown, and risk-adjusted returns (e.g., Sharpe ratio). Compare the strategy’s performance against a benchmark, such as buy-and-hold strategy, to evaluate its effectiveness.
Conduct sensitivity analysis by adjusting the parameters of the Keltner Channel (e.g., EMA period, ATR multiplier) to see how changes impact the strategy’s performance. Identify optimal parameter values that maximize profitability while minimizing risk.
Iteration and Optimization
Iterate on your trading strategy based on the insights gained from backtesting. Refine the entry and exit rules, adjust parameter values, or explore alternative variations of the strategy to improve its performance. Continuously test and validate the updated strategies using historical data to ensure robustness and adaptability across different market conditions.
Final Thoughts
The Keltner Channel stands as a testament to Chester W. Keltner’s pioneering work in technical analysis, offering traders a robust framework for navigating dynamic market environments. Whether used in isolation or in conjunction with other indicators, the Keltner Channel provides valuable insights into trend direction, volatility, and potential trading opportunities. By incorporating backtesting into your trading routine, tarders can make more informed decisions and achieve greater success in the dynamic world of financial markets. However, like any tool in the trader’s toolkit, the Keltner Channel is most effective when integrated into a comprehensive trading strategy supported by sound risk management principles.
Share on Social Media:


Leave a Reply