
When it comes to developing and refining a trading strategy, historical price data is indispensable. This data not only allows traders to test how their strategies would have performed in past market conditions but also helps fine-tune their approach for future trades. However, not all historical price data is created equal, and finding reliable data is just the first step. Equally important is data preparation and cleaning, where traders ensure that the data is free from errors, anomalies, or inconsistencies that could skew backtesting results.
In this article, we’ll explore various sources of historical price data—both free and paid—along with the key factors that affect data quality. I will also guide you through the process of data preparation and cleaning, ensuring your data is accurate, consistent, and ready for effective backtesting.
Types of Historical Data
There are different types of historical data available:
- Price Data: Includes open, high, low, close (OHLC) prices for any asset. This is the most widely used type of data for backtesting.
- Volume Data: Represents the number of shares or contracts traded during a given period. Volume data is required for volume-based indicators such as the Volume Weighted Average Price (VWAP).
- Fundamental Data: Includes earnings reports, dividends, and other financial metrics that may be used in strategies focusing on a company’s fundamental value.
- Economic Data: Macroeconomic indicators like GDP growth, interest rates, or inflation figures, which can be particularly relevant for strategies involving forex or commodities.
Where to Get Historical Price Data (OHLC Data)
There are free and commercial sources of historical price data. Let`s start with free sources.
Free Sources of Historical Price Data (OHLC Data)
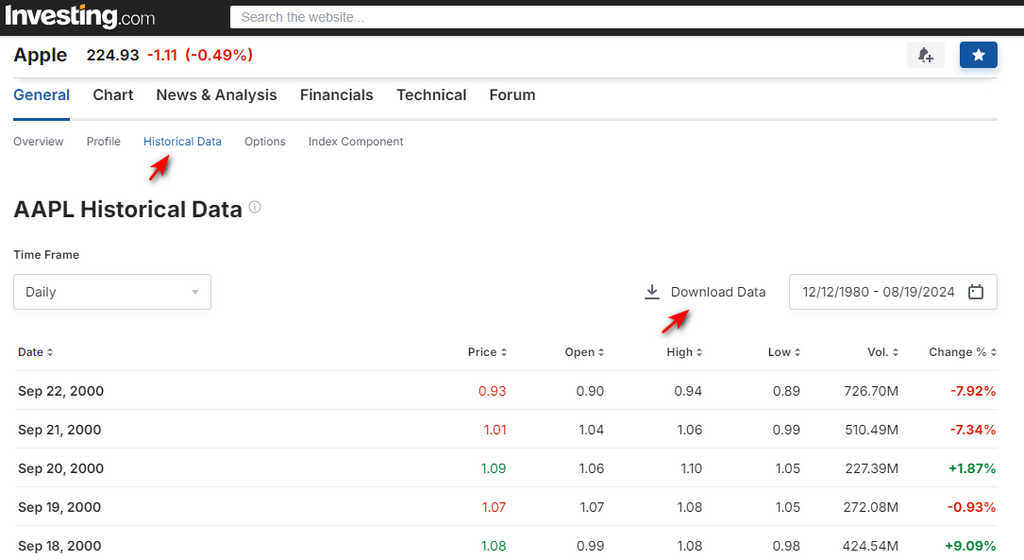
For traders who are just starting out or looking to backtest strategies without any additional expenses, there are several dependable sources of free historical price data. While these sources generally provide daily price data, this is often sufficient for strategies focusing on longer-term trends. Two of the most commonly used free data sources are Yahoo Finance and Investing.com. Yahoo Finance offers historical OHLC data for a broad range of assets, including stocks, indices, ETFs, forex, and cryptocurrencies. However, note that Yahoo Finance no longer provides downloadable CSV files directly. Alternatively, Investing.com offers free access to daily price data for the same wide range asset classes, which can be directly downloaded as CVS file. Perfect for Excel users.
To access historical data:
- Search for the ticker on Investing.com.
- Click on “Historical Data,” select the desired time interval, and once the historical data is displayed, click on “Download Data.” You will receive the data in a CSV file that can be opened with Excel.
Commercial Sources of Historical Price Data (OHLC Data)
For traders requiring higher quality, more granular data, paid data sources are often the best option. These providers offer data with fewer gaps, more frequency options (such as minute or tick data), and adjustment for corporate actions like splits and dividends. A stock split changes the number of shares outstanding, affecting the price. For backtesting to remain accurate, the historical data needs to reflect split-adjusted prices. But the use of dividend-adjusted or non-adjusted prices depends on strategy used and settings of charting platform. If you choose dividend-adjusted prices for backtesting, make sure to use the same adjustment in live trading to maintain consistency.
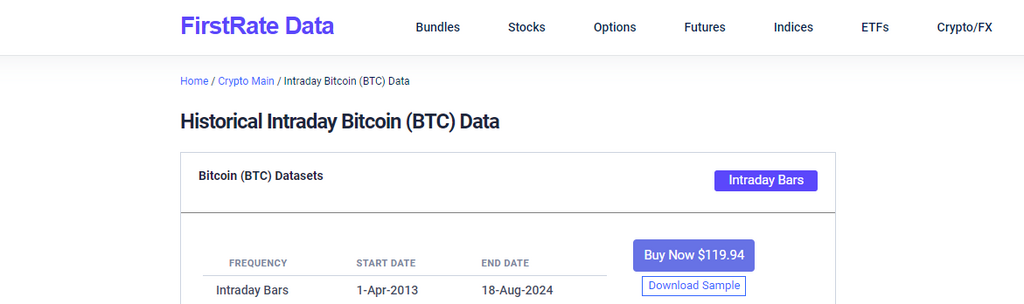
- FirstRate Data specializes in providing high-quality historical data for equities, ETFs, futures, forex and crypto. They offer data with minute and tick-level granularity, making it suitable for both intraday and high-frequency trading strategies.
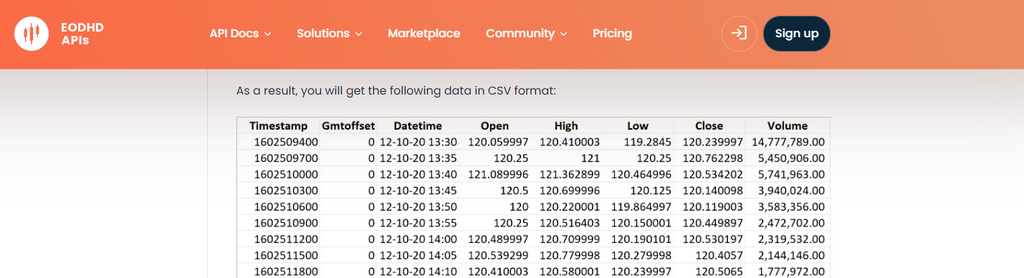
- EODHD APIs offers a range of APIs that provide historical price data for global stocks, ETFs, mutual funds, indices, and cryptocurrencies. Their intraday price data is available mostly in minute intervals.
- Pi Trading offers several bundles with one-minute intraday historical price data for 500 or 1200 of the most popular and actively traded stocks, ETFs, and indices. Pi Trading has affordable pricing and the quality of its data.
- TickData offers high-frequency historical data, including tick-by-tick data, which is essential for high-frequency traders. Their data is well-regarded for its accuracy and completeness.
For a deeper review of historical data providers, you can refer to the ranking conducted by Quantpedia, which can help you evaluate different sources based on factors such as data quality and pricing.
It’s important to note that the price of data does not always correlate with its quality. Some data providers may set high prices due to branding, customer service, or other factors unrelated to the data’s accuracy or completeness. Conversely, lower-priced data can sometimes offer excellent value. No matter the price of the OHLC data, it must be checked for quality before use.
Examine Data Quality
The most efficient way to determine the quality of data is to request samples before purchasing. It’s advisable to request several samples from different years, both older and newer, to assess consistency and accuracy over time. You can use a dedicated Excel spreadsheet for data quality tests, where you compare key aspects such as gaps, corporate action adjustments, and alignment with other sources.
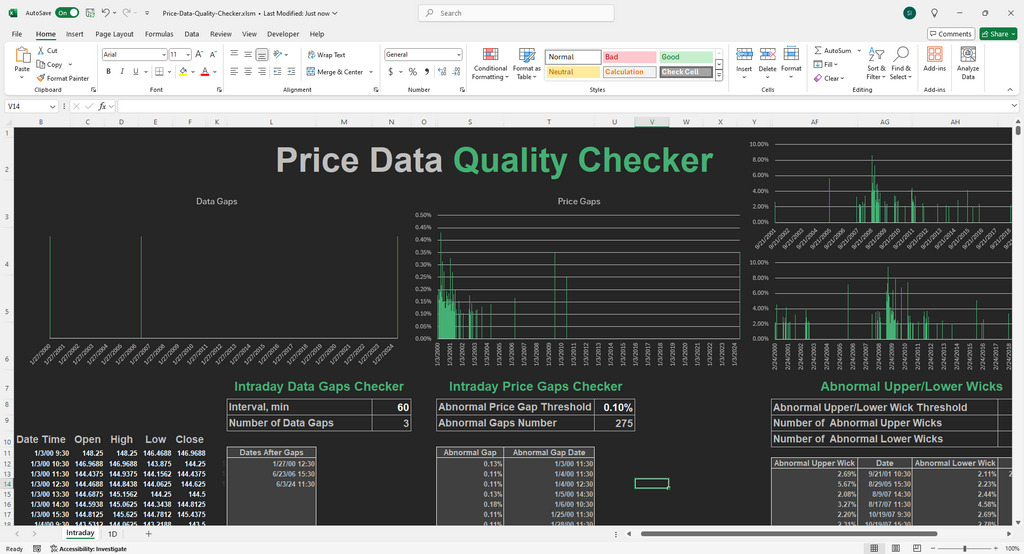
Layout of upcoming Price Data Quality Checker
By taking the time to evaluate data quality carefully, you can ensure that your backtesting efforts are built on a solid foundation, leading to more reliable and actionable insights.
Data Preparation Before Usage
Once you’ve sourced your historical price data—whether from a free or paid provider—it’s crucial to prepare it properly before backtesting. Raw data may have inconsistencies, formatting issues, or missing information that needs to be addressed to ensure the reliability of your backtests. Here’s a step-by-step guide on how to clean, adjust, and prepare your data for optimal use.
Format the Data for Compatibility
The first step is ensuring the format of your data matches the input requirements of your backtesting tool. Most data providers will deliver files in CSV format, but the structure of the file (e.g., column order) might not align with what your software requires.
For example, our backtesting Excel-based spreadsheets expect specific columns like Date, Open, High, Low, Close (OHLC) to be in a precise order. If the data doesn’t align with this format, you’ll need to reorganize it:
- Rearrange columns if necessary. For instance, some sources may have the “Close” column placed differently, and you may need to move it to match the format of your backtesting model.
- If using Investing.com, you’ll need to rename columns (e.g., renaming “Price” to “Close”) and sort the data from oldest to newest.

Free Backtesting Spreadsheet
Converting Historical Price Data from TXT to Excel
Some data providers (for example, FirstRate Data and Pi Trading) offer historical price data in TXT format, which can be easily opened and converted in Excel. Here’s how you can do it in just a few steps:
- Open Excel: Start with a new or blank Excel workbook.
- Open the TXT File:
- Click “File” in the top-left corner of Excel.
- Select “Open” from the menu.
- Navigate to the location where your TXT file is saved.
- In the file type dropdown menu, select “All Files” so that your TXT file appears in the list.
- Select the TXT file and click “Open.”
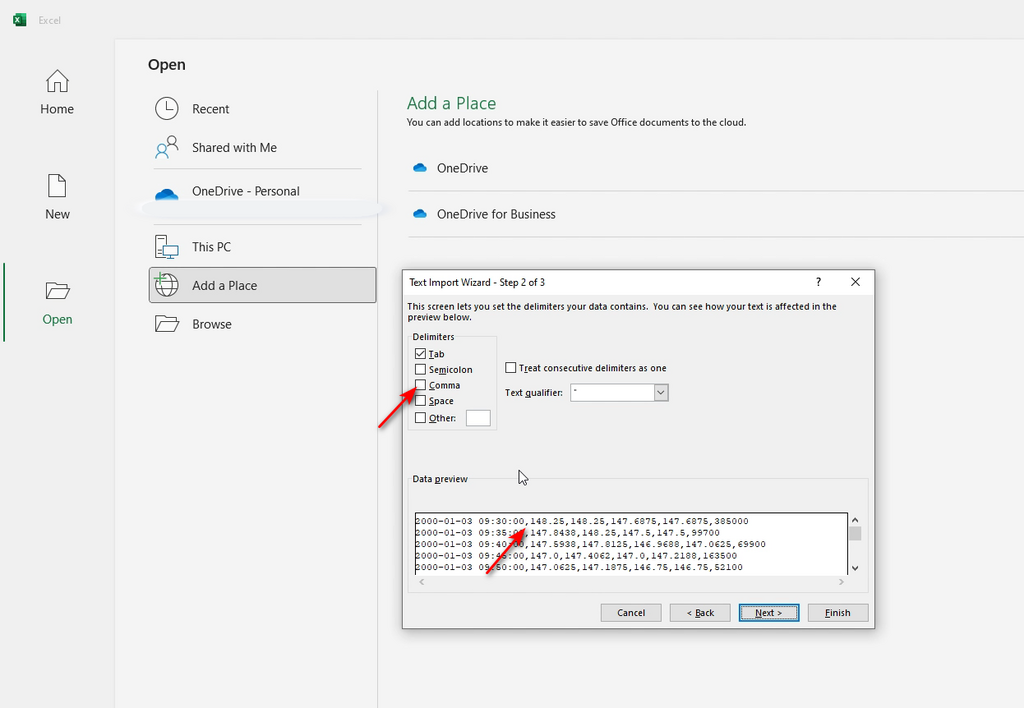
- Select Delimiter Format:
- When the Text Import Wizard opens, choose whether your data is delimited (separated by commas, tabs, or spaces) or fixed width.
- For most price data files, you will choose “Delimited” and click “Next.”
- Choose the Delimiter:
- Choose the delimiter that separates your data (commas, tabs, or spaces). Typically, it’s a comma or a tab.
- Excel will preview how the data will be divided into columns.
- Click “Next” once the columns are aligned correctly.
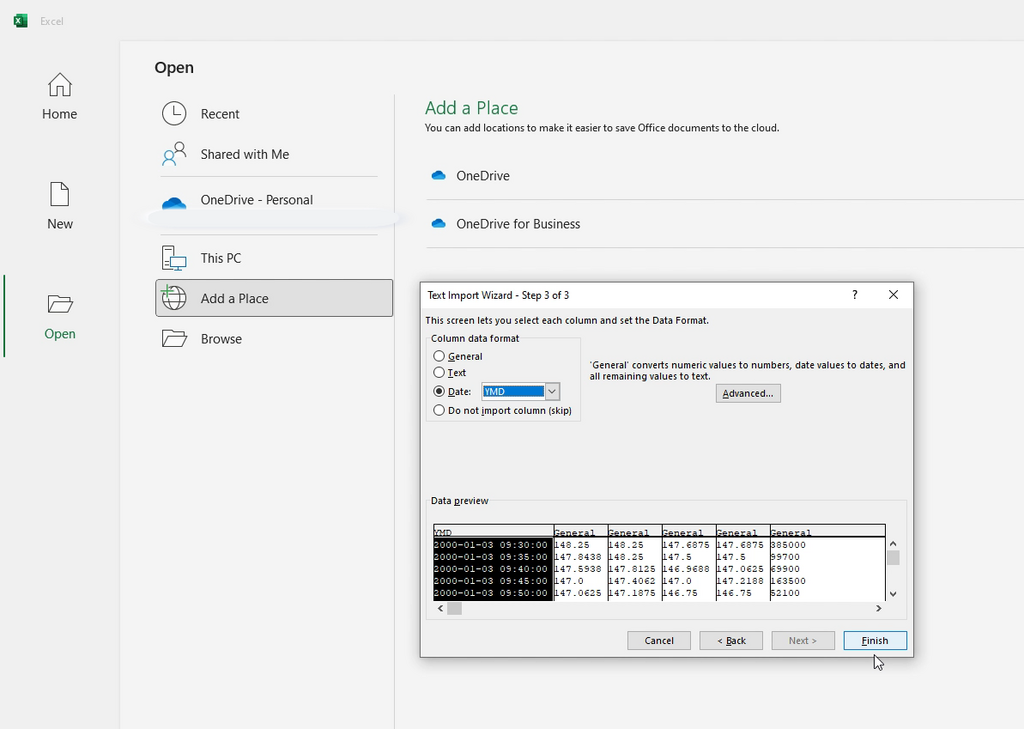
- Finish the Import:
- Review the column formats. Make sure Date is set as a Date format. Choose Year, Month, Date sequence (YMD, YDM) that fits your data.
- Click “Finish.”
- Save as Excel:
- Once the data is properly opened and formatted in Excel, save it by clicking “File” > “Save As”.
- Choose Excel Workbook (.xlsx) as the file format and save it to your desired location.
Quick Tip:
If the data appears in one column or isn’t formatted correctly, repeat the steps and make sure you choose the correct delimiter (commas, tabs, etc.) during the import process.
Once converted, you’re ready to use the data for backtesting or analysis in Excel!
Handle Missing Data
Missing data is a common issue, particularly during periods of low trading volume (e.g., holidays, weekends, or non-trading hours). Data providers often omit intervals where no trades occur. Failing to address these gaps can lead to misleading backtest results, making it crucial to handle them effectively.
There are a few methods to deal with missing data, but not all are equally reliable:
- Fill Forward/Backward: One approach for dealing with intraday gaps is to fill the missing data points by carrying forward the last available price (fill forward) or using the next available price (fill backward). This method is often used to keep the data series continuous, but it should be applied with caution. Low liquidity or inactivity during the missing period might mean that no real trades were taking place, and filling these gaps could distort the results by assuming price continuity where there was none.
- Discarding Data (Recommended Approach): The most reliable method for handling significant data gaps is to discard the entire period where such gaps are frequent. This doesn’t mean simply omitting the missing data point—it involves excluding entire periods where gaps are common, such as non-trading hours or low liquidity periods like holidays. For instance, if you are backtesting an intraday strategy, it’s often best to exclude data outside of regular trading hours, as the lack of trading activity can lead to unreliable price movements and misleading indicator values. By discarding these periods, you ensure that your backtest focuses on times when the market was actively trading, which provides a more accurate and reliable representation of your strategy’s performance.
Verify Historical Price Data Accuracy
One of the most critical steps in data preparation is verifying the accuracy of your data. Even small discrepancies in historical prices can lead to vastly different backtesting outcomes. Here’s how you can verify the accuracy of your data:
- Cross-Check with Other Sources: If you have access to multiple data providers, compare the data across sources to ensure consistency. If discrepancies arise, investigate the reason (e.g., wrong split adjustment, pricing error). Note! It is normal for decentralized markets to have slight variations in price data depending on provider/exchange. The best practice is to accept this variability and backtest your strategy using price data from multiple sources. If your strategy performs consistently well across these different datasets, it indicates that the strategy is robust and reliable.
- Look for Outliers: Check for abnormal price movements or outliers in the data. These can often be the result of input errors or corporate actions that weren’t adjusted correctly.
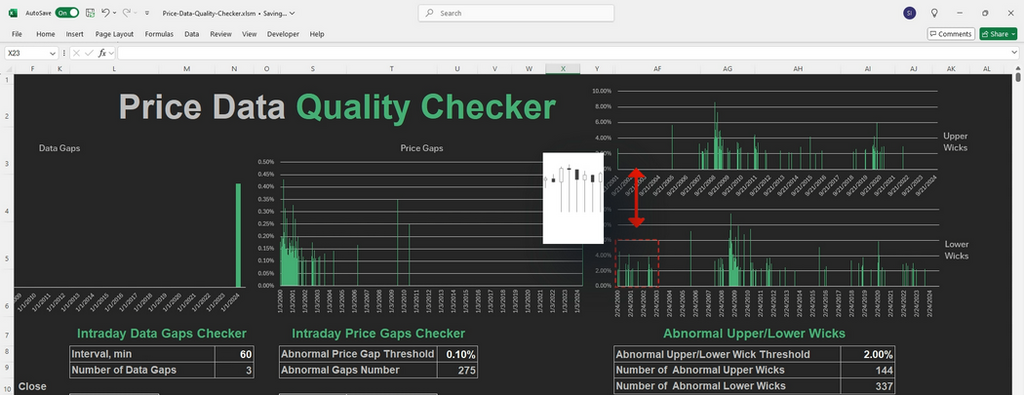
Abnormal price movements analysis in Price Data Quality Checker
Ensure Time Zone Consistency
Many traders overlook time zone discrepancies, which can significantly impact intraday backtests. Different exchanges and data providers may use different time zones (e.g., UTC, Eastern Time, etc.), leading to misalignment in entry and exit points.
- Verify the time zone of your data and convert it to match the time zone of trading platform you’re using.
- For global strategies involving multiple markets (e.g., forex or commodities), time zone consistency is critical to avoid misinterpreting when certain price movements occurred.
Excel Tools for Data Preparation
Data preparation is an essential step before backtesting, and Excel is a powerful tool for handling many of the tasks involved. For traders working with smaller datasets or those who prefer a more hands-on approach, Excel offers the flexibility and functionality needed to clean and prepare historical price data efficiently.
Excel is well-suited for most data preparation tasks, such as sorting, filtering, and identifying gaps in data. Here’s how Excel can assist with various steps:
- Sorting and Filtering: Excel’s built-in sorting and filtering functions allow you to organize data easily by date, asset, or any other parameter. This ensures that your dataset is structured correctly for backtesting.
- Handling Missing Data: You can use Excel’s functions, such as IFERROR, LOOKUP, or custom formulas, to manage missing data. Additionally, creating a rule to discard periods with frequent gaps (e.g., non-trading hours) can be easily implemented by filtering out these rows based on time stamps.
- Custom Macros: For repetitive tasks such as adjusting for splits or reformatting data, Excel macros allow you to automate these actions. By creating custom VBA scripts, you can standardize the data preparation process and reduce the risk of manual errors.
- Data Visualization: Excel’s charting features help visualize the data for spotting outliers or gaps that need further cleaning. You can use graphs like line charts to quickly see where missing or irregular data points occur.
Final Thoughts
Data preparation is a vital step in the backtesting process, whether you use free or commercial sources of data. While obtaining historical price data is the first step, ensuring that the data is clean, properly adjusted, and aligned with your strategy is equally important. Failing to prepare your data correctly can lead to misleading backtest results and poor strategy performance in live markets.
Share on Social Media:


Leave a Reply