Traders and investors rely on multiple tools and indicators to filter out noise and identify significant price movements. Among these tools, the exponential moving average (EMA) is likely the most used for gaining insights into market trends and identifying potential entry and exit points. This article covers the definition and calculation method of the EMA, as well as its applications, strengths, and limitations. Additionally, you will find an Excel template for backtesting with the EMA indicator.
Understanding the Exponential Moving Average (EMA)
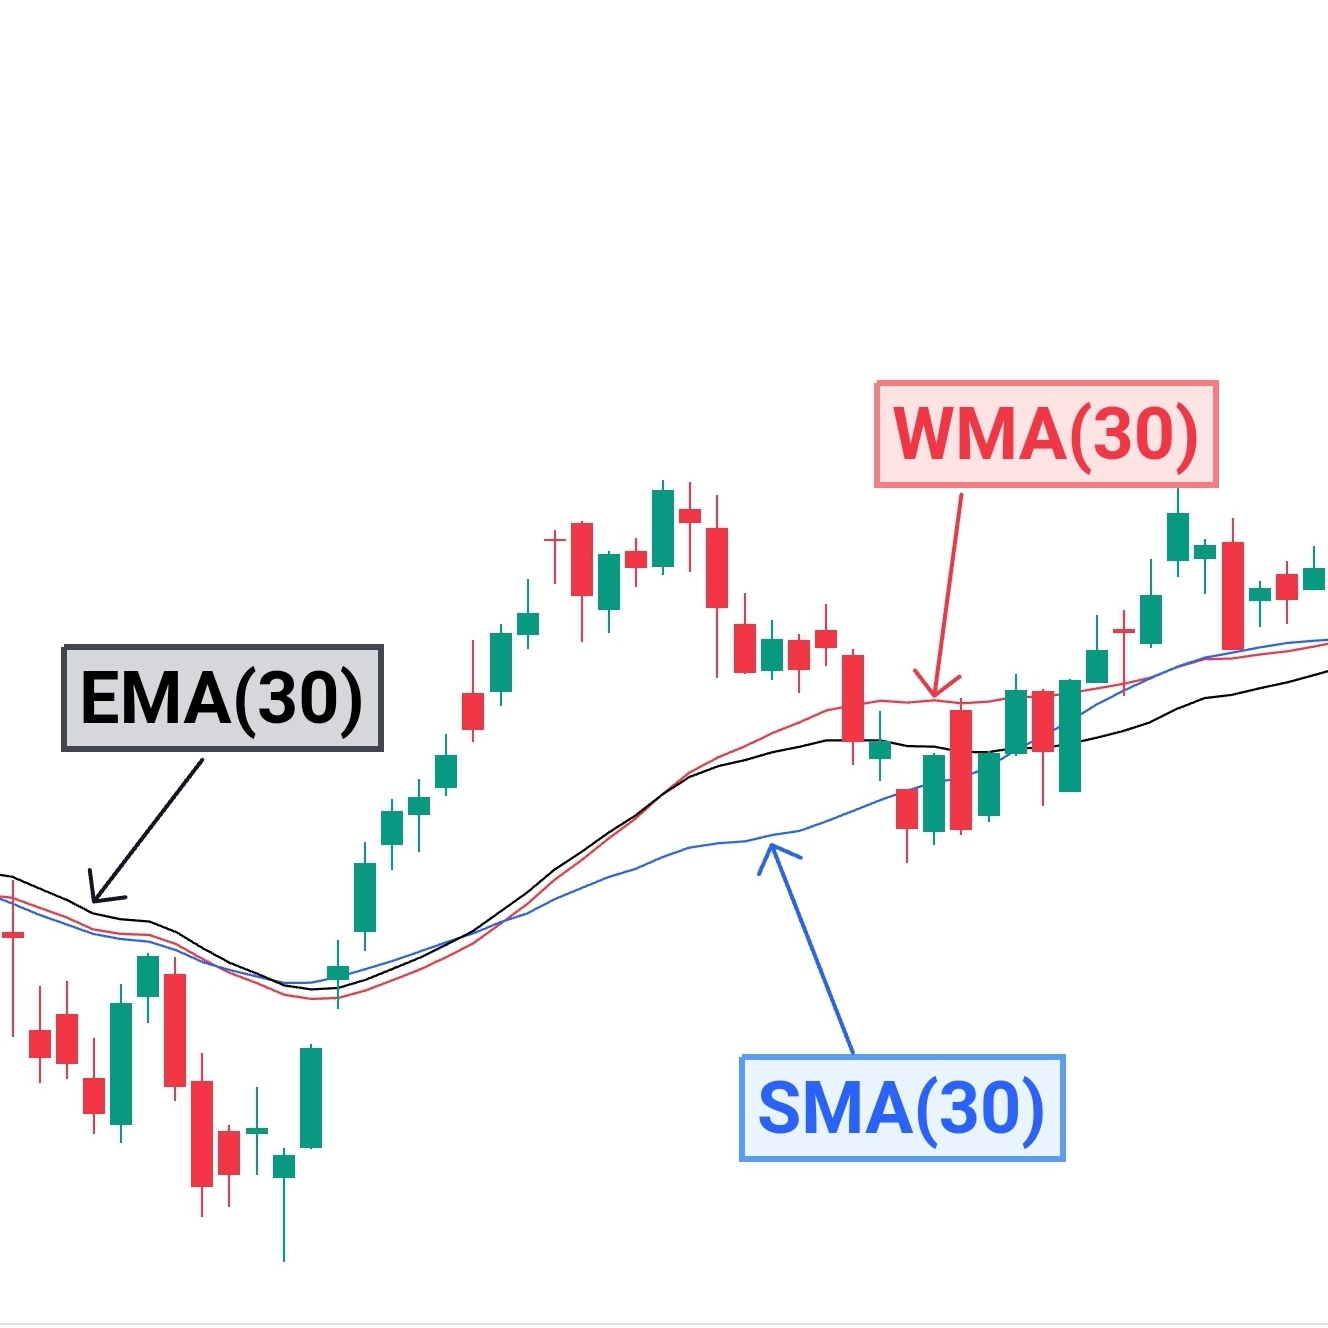
The exponential moving average (EMA) is a type of moving average that prioritizes recent price data while diminishing the significance of older data points. Unlike its simpler counterpart, the Simple Moving Average (SMA), which assigns equal weight to all data points within the specified period, the EMA employs an exponential weighting scheme. This means that it reacts more swiftly to recent price changes, making it particularly adept at capturing short-term trends.
The EMA Formula
The formula for calculating the EMA involves multiple steps, but fear not, as modern trading platforms and financial software handle these computations automatically. However, understanding the underlying mechanics can enhance one’s comprehension of the indicator’s behavior.
- Select a Time Frame: Determine the time period over which you want to calculate the EMA (e.g., 10 days, 50 days, or 200 days).
- Gather Price Data: Collect the closing (or opening) prices for the specified period.
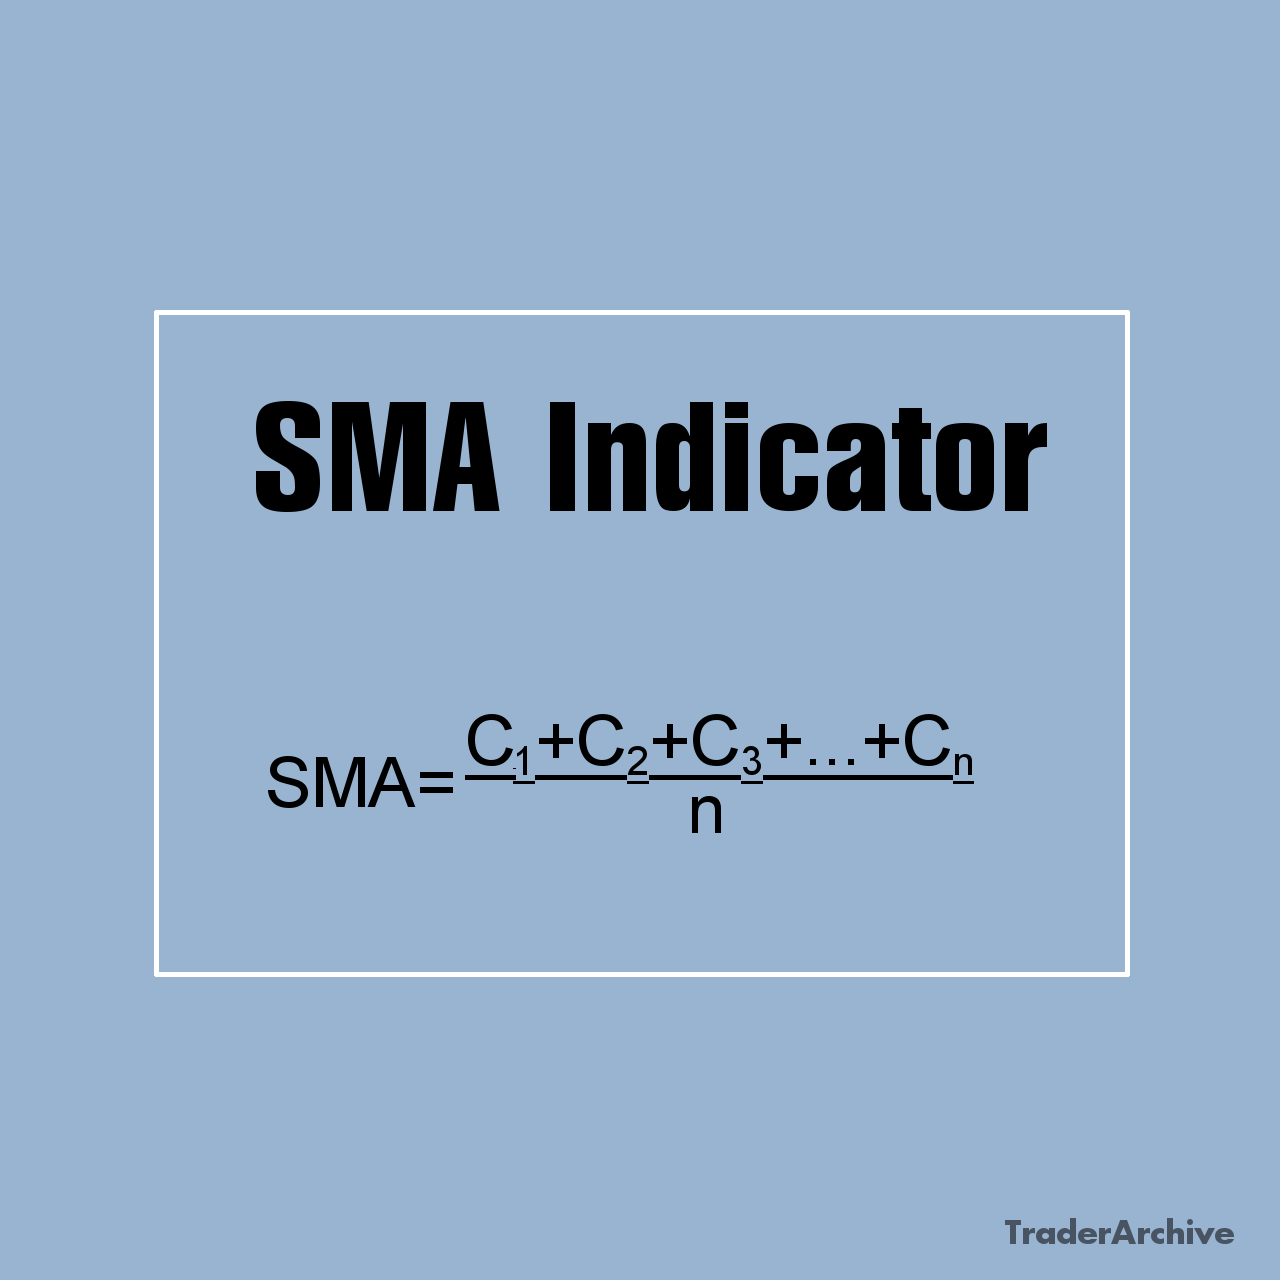
- Calculate the SMA: Compute the Simple Moving Average for the chosen time frame. This involves summing up the closing prices and dividing them by the number of periods. The SMA is required for the initial step of EMA calculation.
- Calculate the Multiplier: The multiplier represents the weighting applied to the most recent data point. The multiplier formula is following: 2/(n+1), where n is the number of periods.
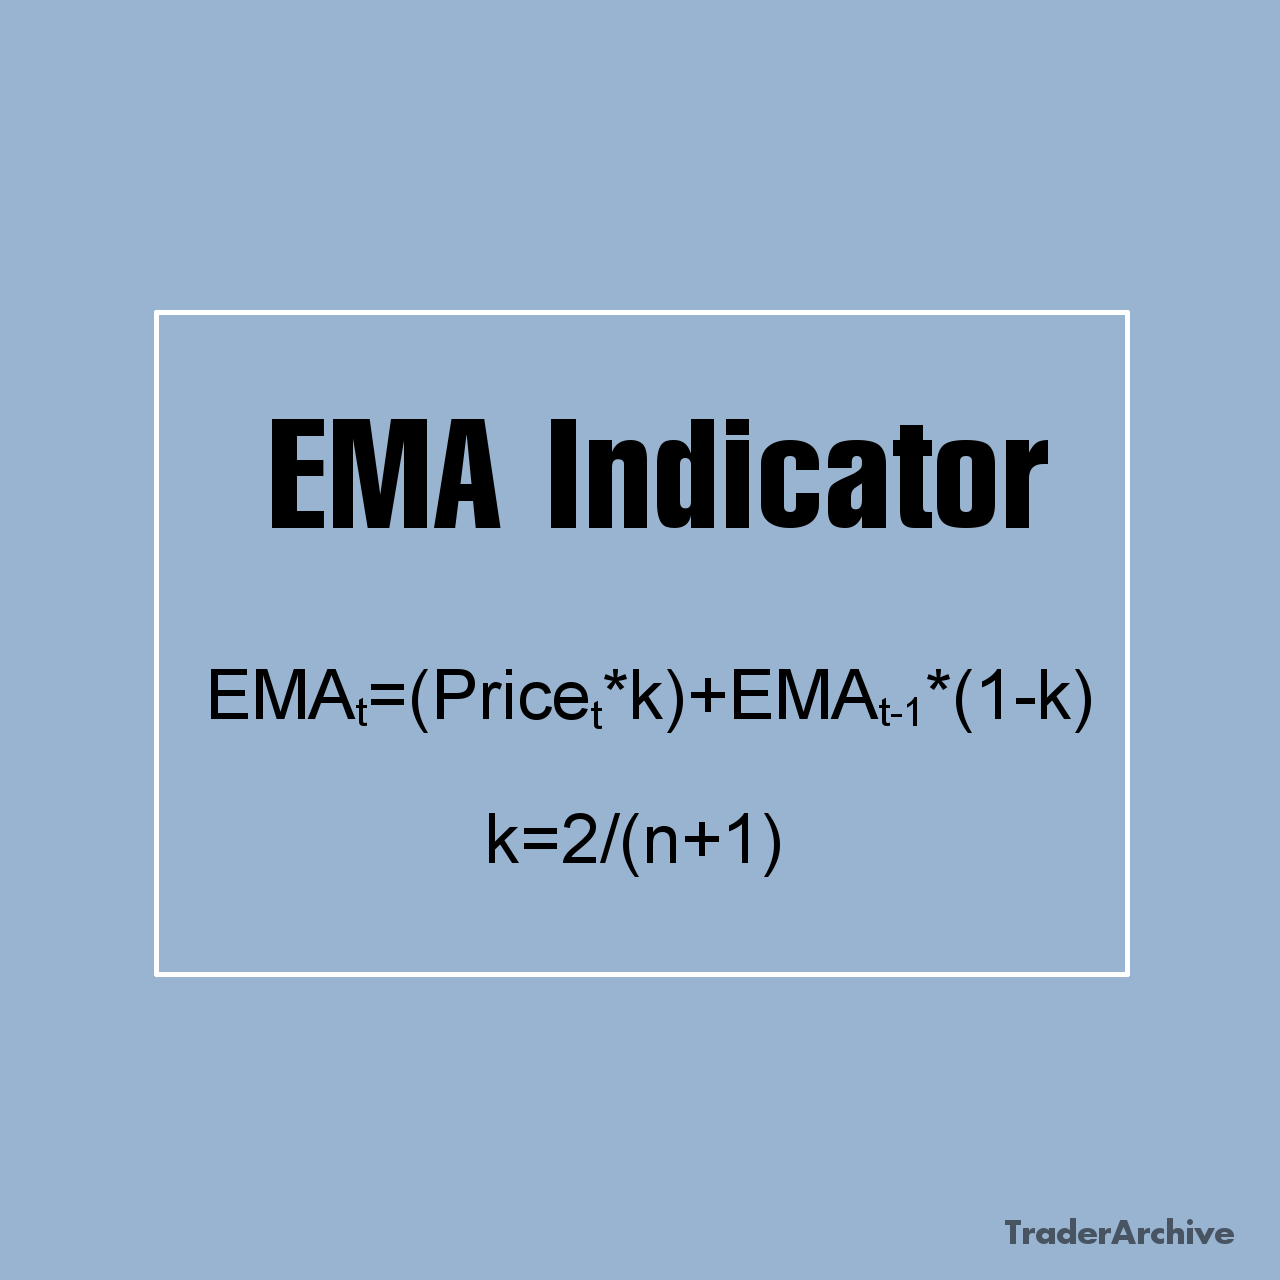
- Compute the EMA: Finally, use the multiplier to exponentially weight each data point, giving more prominence to recent prices. The formula for calculating the EMA is:

Applications of the EMA
Trend Identification
One of the primary uses of the EMA is to identify trends in the price action. By comparing short-term and long-term EMAs, traders can discern the direction of the prevailing trend. A bullish trend is often signaled when the short-term EMA crosses above the long-term EMA, whereas a bearish trend is indicated by the opposite crossover.
Support and Resistance Levels
EMAs can act as dynamic support and resistance levels. During an uptrend, the EMA tends to provide support, while in a downtrend, it acts as resistance. Traders often look for price bounces or breakouts at these levels to make trading decisions.
Momentum Confirmation
Traders use the slope of the EMA to confirm the momentum of a trend. A steeply rising EMA indicates strong bullish momentum, whereas a sharp decline suggests bearish momentum. Conversely, a flat EMA may indicate a lack of conviction in the market.
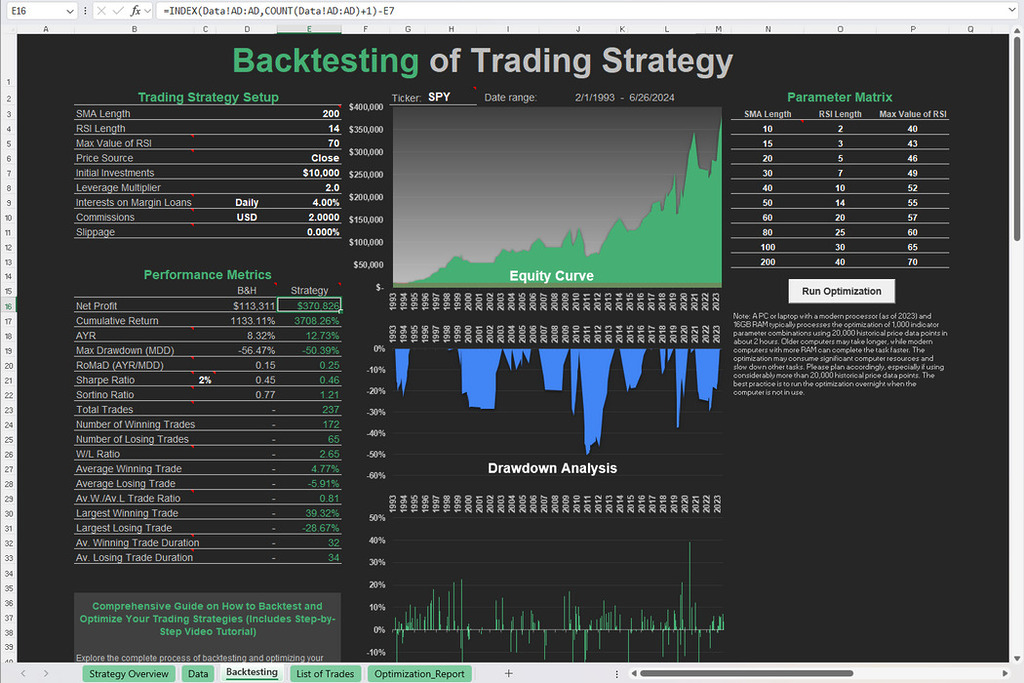
Free Backtesting Spreadsheet
Limitations of the EMA
- Whipsaws: Like any trend-following indicator, the EMA is susceptible to whipsaws, wherein false signals occur during periods of choppy or sideways price action.
- Lagging Nature: Despite its responsiveness, the EMA still lags behind current price movements, which may result in delayed signals, especially during fast-paced market conditions.
- Subjectivity: Interpretation of EMA signals may vary among traders, leading to subjective analysis and potentially conflicting trading decisions.
- Parameter Sensitivity: The performance of the EMA can be sensitive to the choice of parameters (e.g., time frame), requiring careful optimization to maximize effectiveness.
Choosing the Right Parameters
The selection of EMA number of periods (or length) depends on the trader’s investment horizon and trading style. For short-term traders aiming to capitalize on immediate price movements, shorter EMA are typically preferred. These may include periods as low as 5 or 10, allowing traders to capture rapid price changes and generate timely signals. On the contrary, longer-term investors seeking to identify sustained trends and filter out short-term fluctuations often opt for longer EMA periods, such as 50 or 200. These longer periods provide a broader perspective on market movements, helping investors stay focused on overarching trends while minimizing the impact of short-term noise.
The process of determining the optimal EMA parameters involves experimentation and backtesting. Traders should leverage historical data to analyze the performance of different EMA configurations across various market conditions. By conducting thorough backtesting, traders can identify patterns, strengths, and weaknesses associated with different parameter settings. This empirical approach allows traders to refine their strategies and select EMA parameters that align with their trading goals and preferences.
Backtesting with EMA Excel Template
Backtesting stands as a crucial phase in both developing and validating trading strategies. This process involves analyzing historical data and executing simulated trades according to predetermined rules. Through this method, traders can evaluate the effectiveness of their strategies, pinpointing potential strengths and weaknesses before implementing them in real-market scenarios. Let’s delve into the process of conducting backtesting using historical data and an Excel spreadsheet.
Gathering Historical Data
The first step in backtesting is obtaining high-quality historical data for the asset or market being traded. Many financial websites and data providers offer historical price data for various instruments, including stocks, forex pairs, and commodities. It’s essential to ensure that the data is accurate, reliable, and covers a sufficiently long-time horizon to capture diverse market conditions. You can start with Investing.com which provides free historical data in 1D time frame.
Setting Up the Excel Spreadsheet
Once the historical data is acquired, you can create a simple Excel spreadsheet to conduct your backtesting. The spreadsheet should include columns for date, open, high, low, close prices, as well as any additional indicators or variables used in the trading strategy. You can download Excel template for EMA indicator which was created for your convenience.
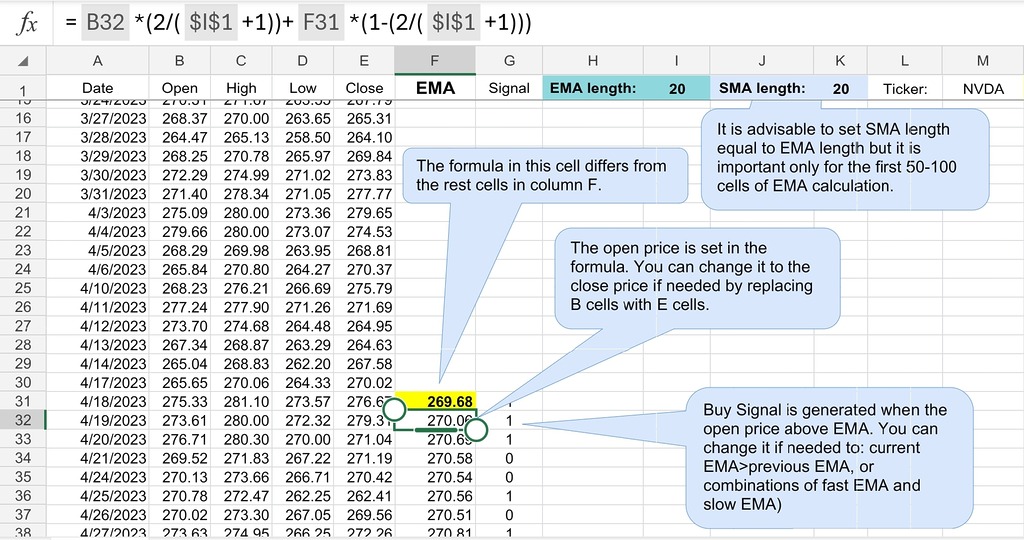
Data Input: Enter historical price data into the spreadsheet, including date, open, high, low, and close prices.
EMA Calculation: Add column to calculate the exponential moving average for different periods. Utilize function specified in the template to calculate the EMA based on the specified length.
Signal Generation: Create columns to generate buy and sell signals based on predefined rules. In the template, a buy signal occurs when price is above EMA. Part of the job is done in our template, so you just need to fit it to your strategy backtesting spreadsheet.
Trade Execution: Implement columns to track trade executions, including entry and exit prices, position size, and profit/loss calculations.
Final Thoughts
The Exponential Moving Average (EMA) stands as a cornerstone of technical analysis, offering traders valuable insights into market trends, momentum, and potential trade setups. Its ability to adapt to changing market conditions and provide clear signals makes it a favored tool among traders of all experience levels. However, traders should exercise caution and combine the EMA with other indicators and risk management techniques to mitigate its limitations and enhance overall trading effectiveness. With a thorough understanding of its mechanics and applications, traders can leverage the power of the EMA to navigate the dynamic landscape of financial markets with confidence and precision.
Share on Social Media:


Leave a Reply