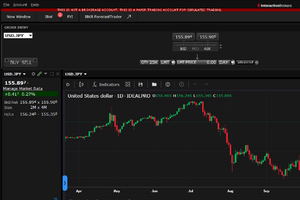
Indicators
Technical indicators are mathematical calculations or visual representations derived from historical price, volume, or open interest data of a financial asset, such as stocks, currencies, commodities, or indices. These indicators are used by traders and analysts to help them understand market trends, identify potential entry and exit points for trades, and gauge the strength or weakness of a particular trend or market movement.
Traders often use a combination of technical indicators to confirm signals and make informed trading decisions. However, it’s important to note that no single indicator is foolproof, and traders should use technical analysis alongside other forms of analysis, such as fundamental analysis and market sentiment, to make well-rounded trading decisions.
-

The Bollinger %b Indicator: A Trader’s Secret Weapon
Discover how Bollinger %b indicator reveals market emotion and trader behavior. Learn how to calculate it in Excel, use it in real strategies, and backtest it.
-

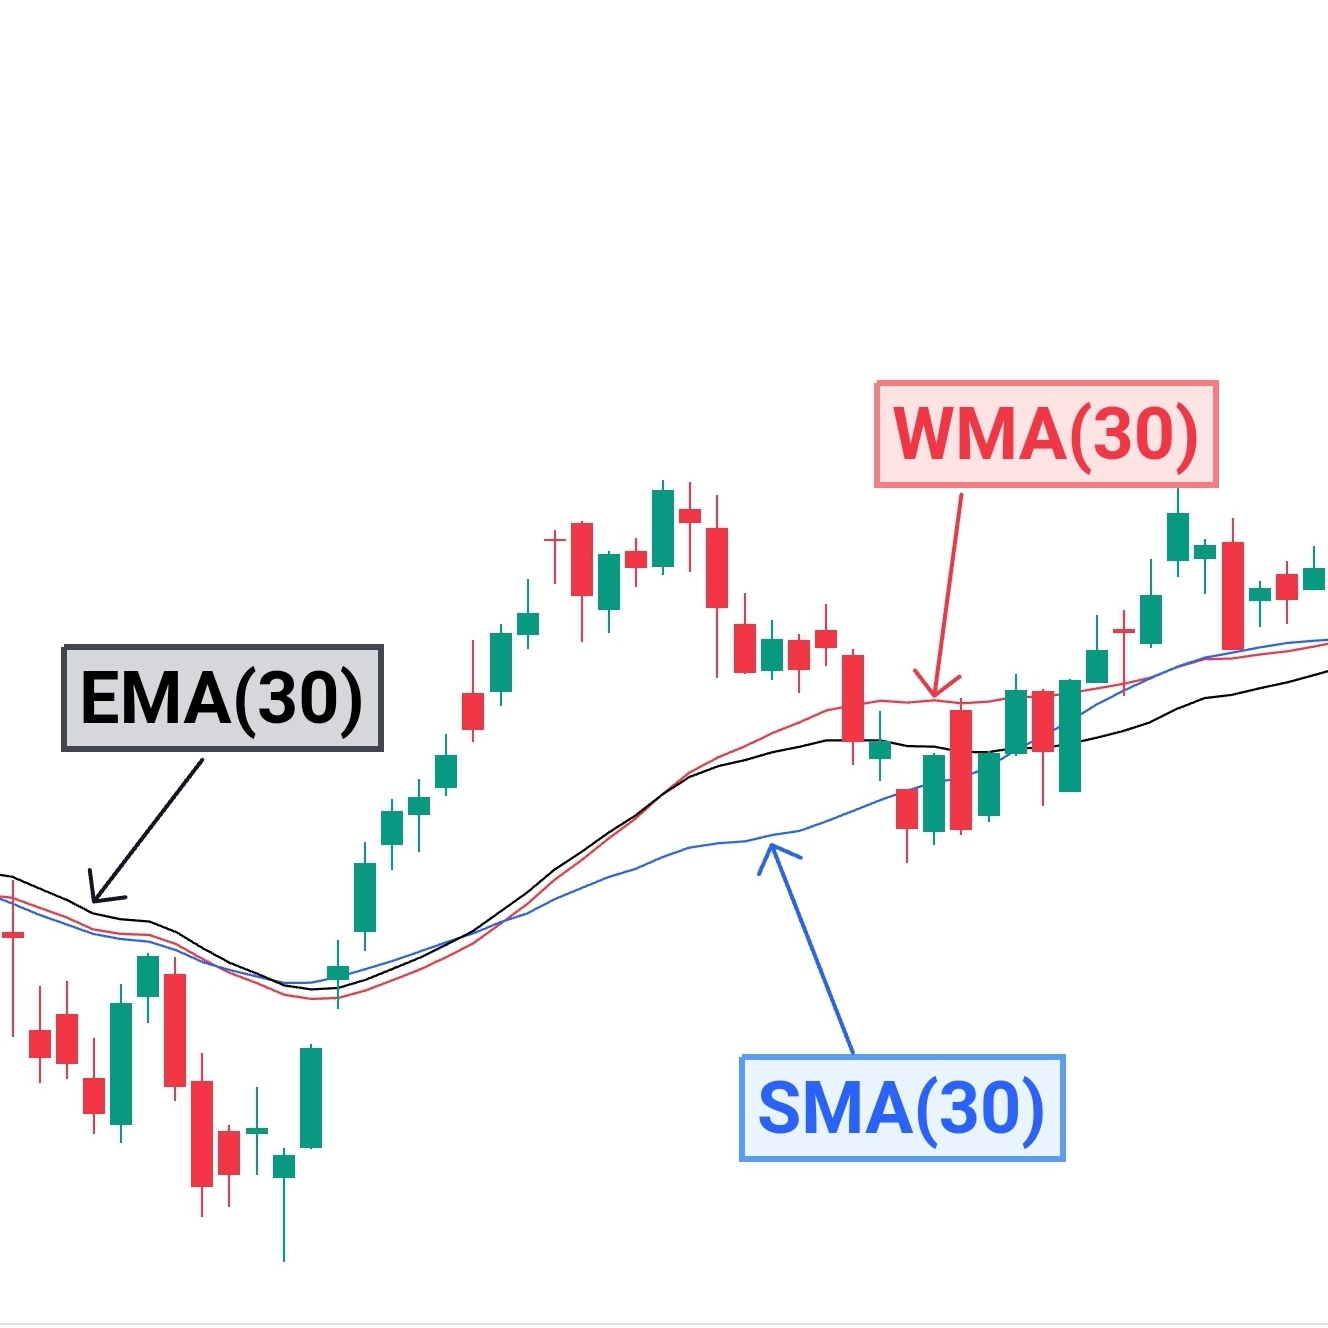
Weighted Moving Average: Formula and Calculation with Excel
Explore weighted moving average (WMA) formula & Excel calculation for trading analysis: Backtesting strategies & market insights for traders.
-

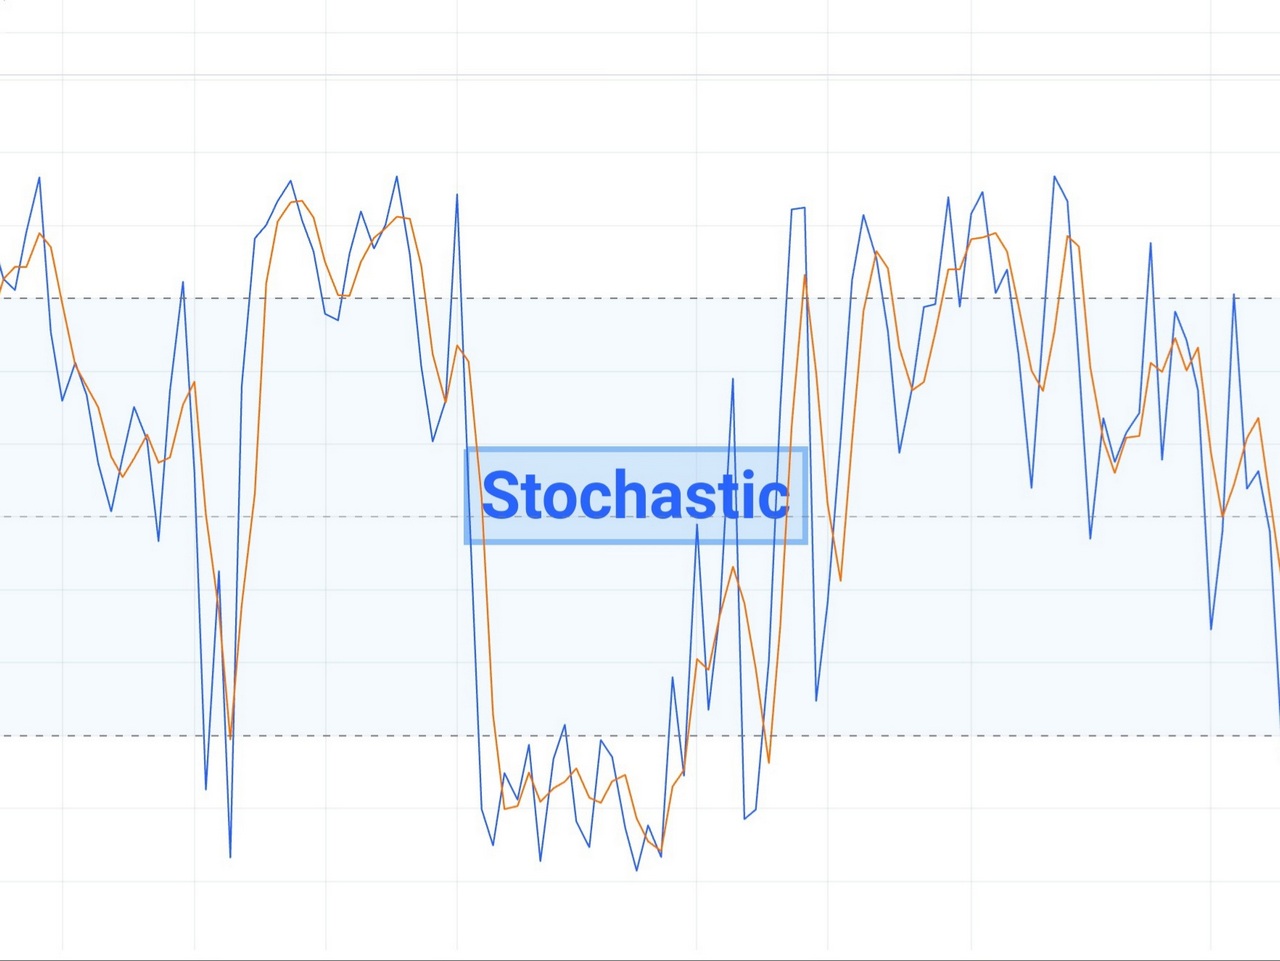
The Stochastic Oscillator: Definition, Calculation and Trading Insights
Learn the stochastic oscillator definition, calculation, and invaluable trading insights – K-D crossovers, divergence and more. Download Excel template for SO.
-

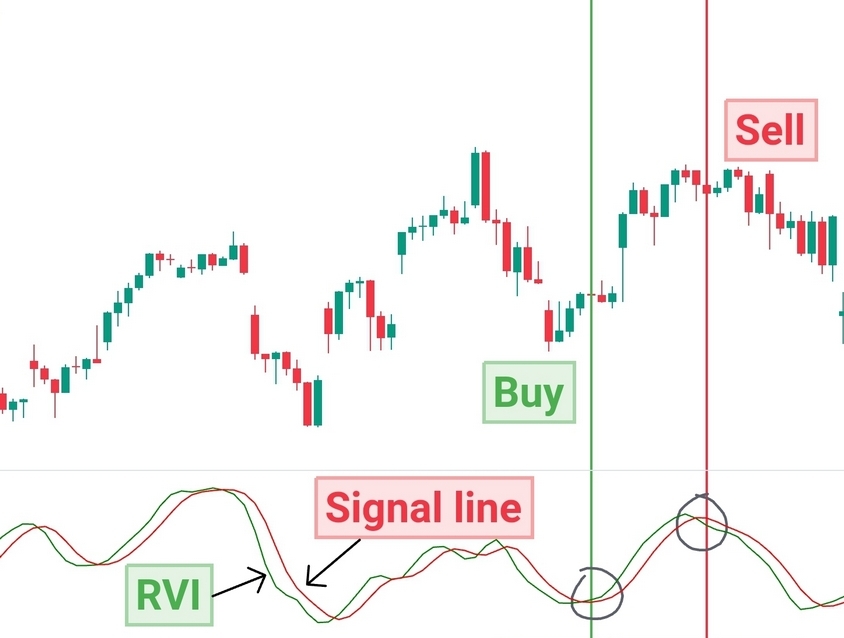
The Relative Vigor Index (RVI) Indicator Guide
Unlock the potential of the relative vigor index (RVI) with our comprehensive guide. Learn strategies, calculation, and backtesting using Excel templates.
-

The MACD Indicator: How to Use, Formulas and Backtesting
The MACD Indicator explained: Learn how to use, formula, backtesting with Excel template and practical applications for navigating financial markets effectively
-

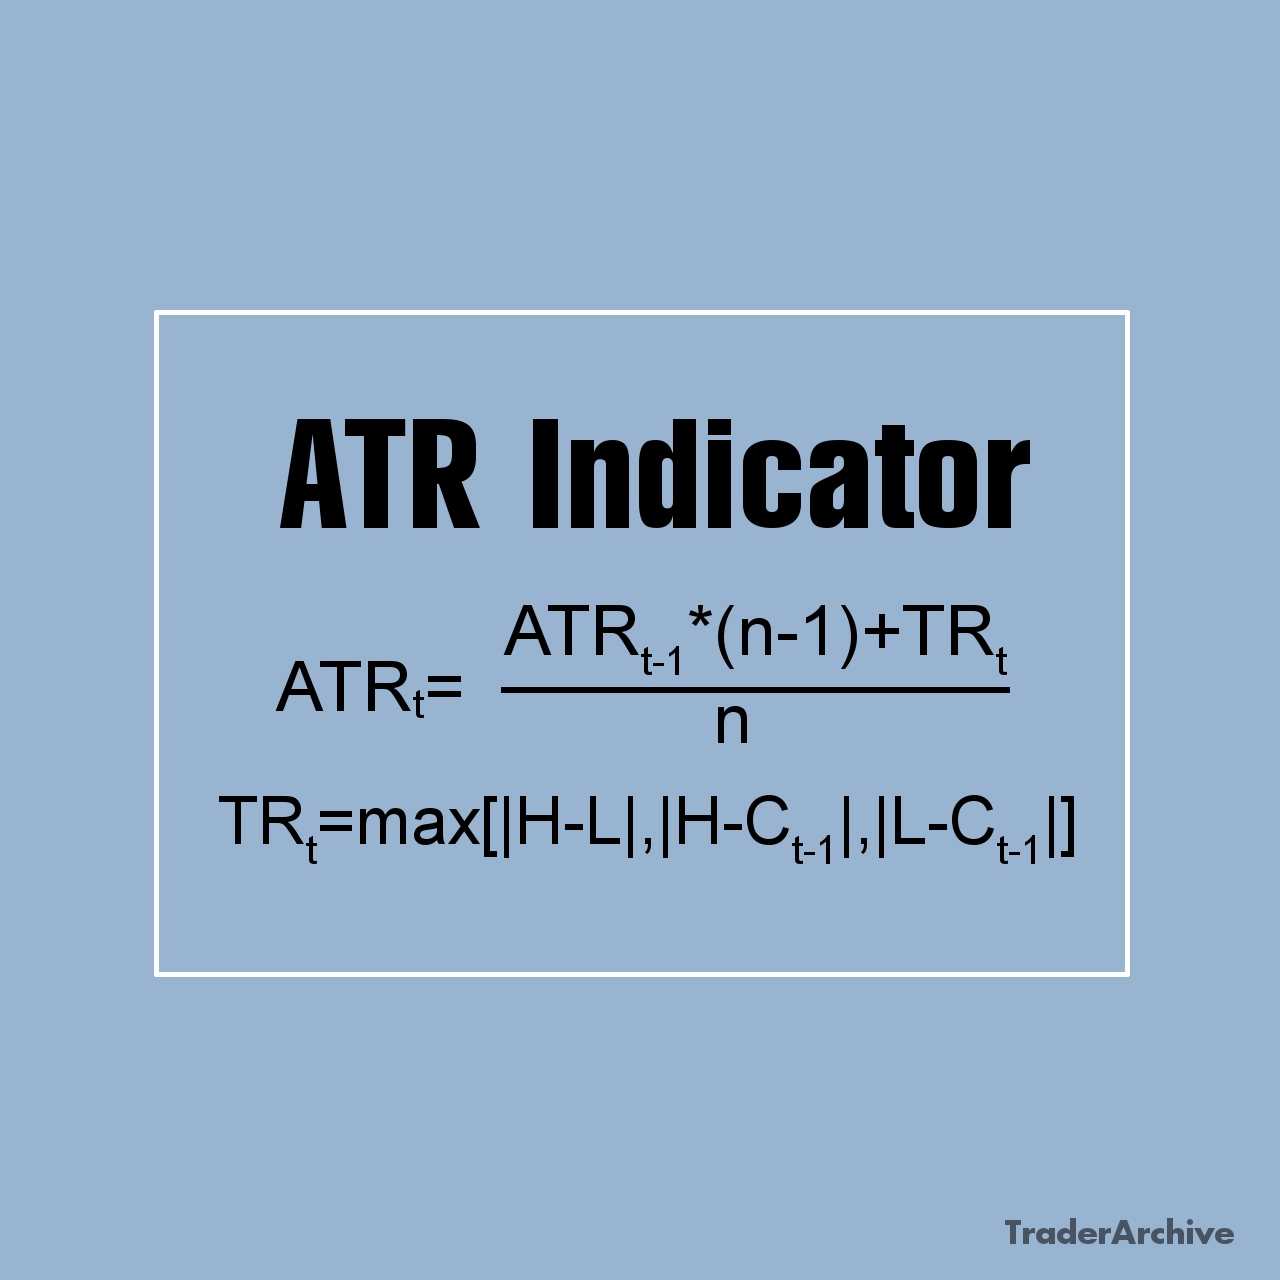
The ATR Indicator Explained. Calculation with Excel Template
Average true tange explained. Discover the ATR Indicator function, calculation methods and its role in trading strategies, alongside a practical Excel template.
-

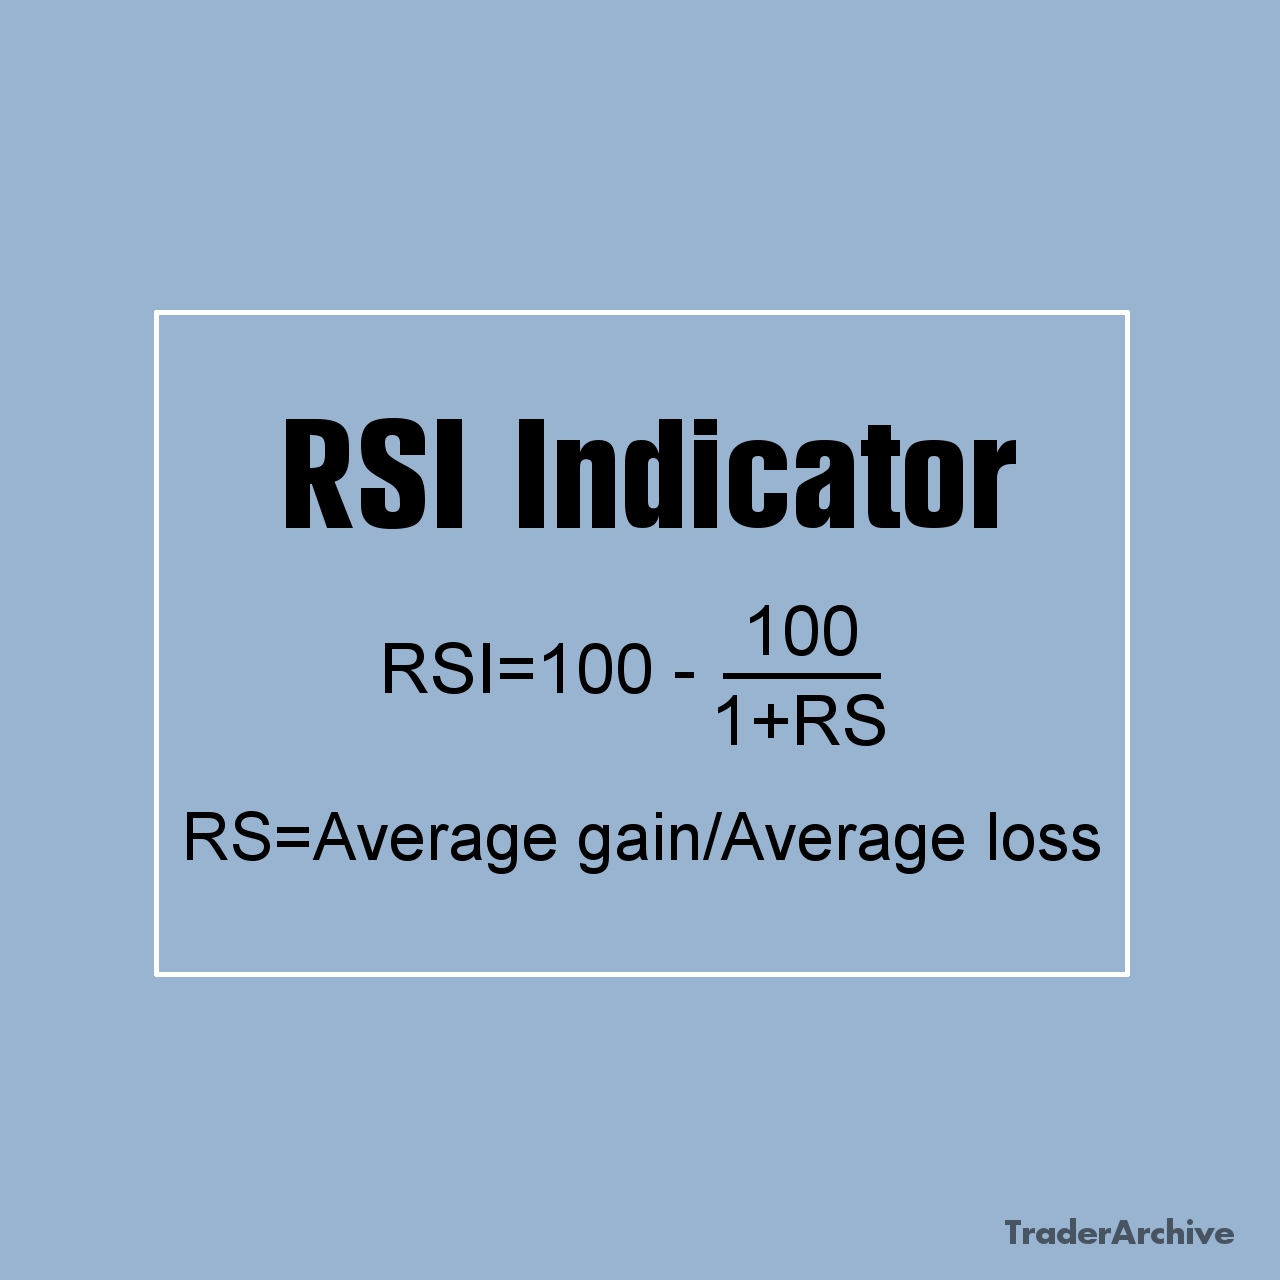
RSI Indicator: Definition and Calculation with Excel Template
Unlock the potential of relative strength index (RSI) indicator: Definition, calculation, Excel template and advanced techniques for enhanced trading strategies
-

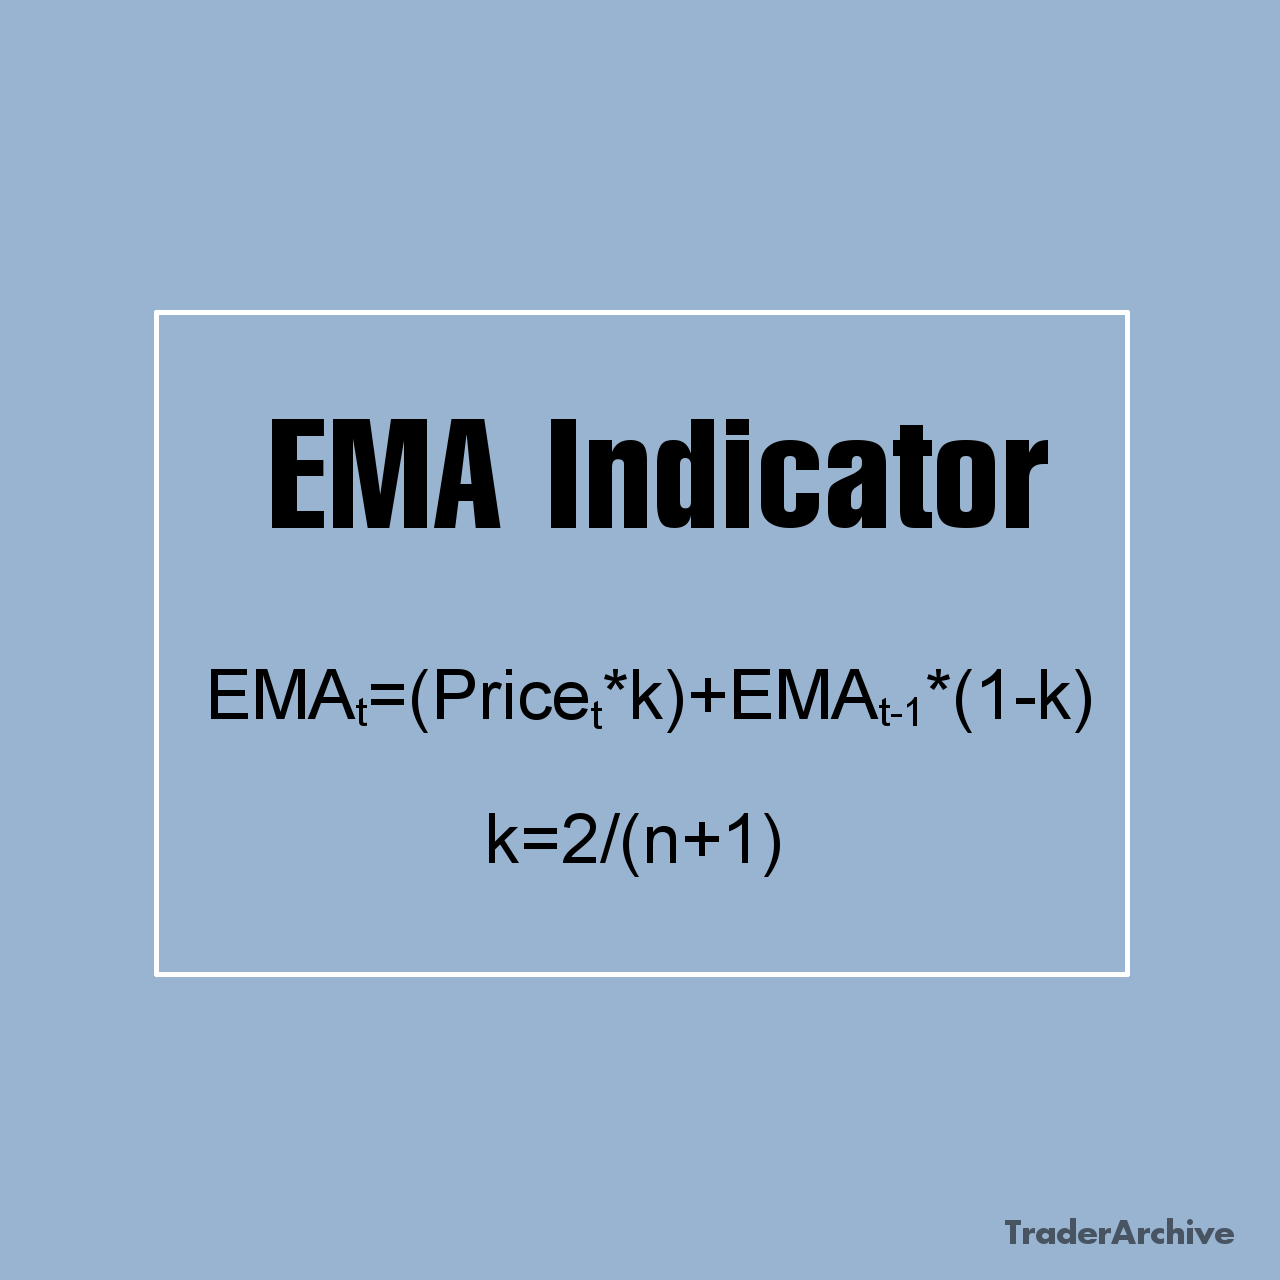
EMA Indicator: Definition, Formula and Excel Template
Explore the Exponential Moving Average (EMA) Indicator, its definition, formula, and an Excel template for backtesting. How to choose the right EMA length.
-

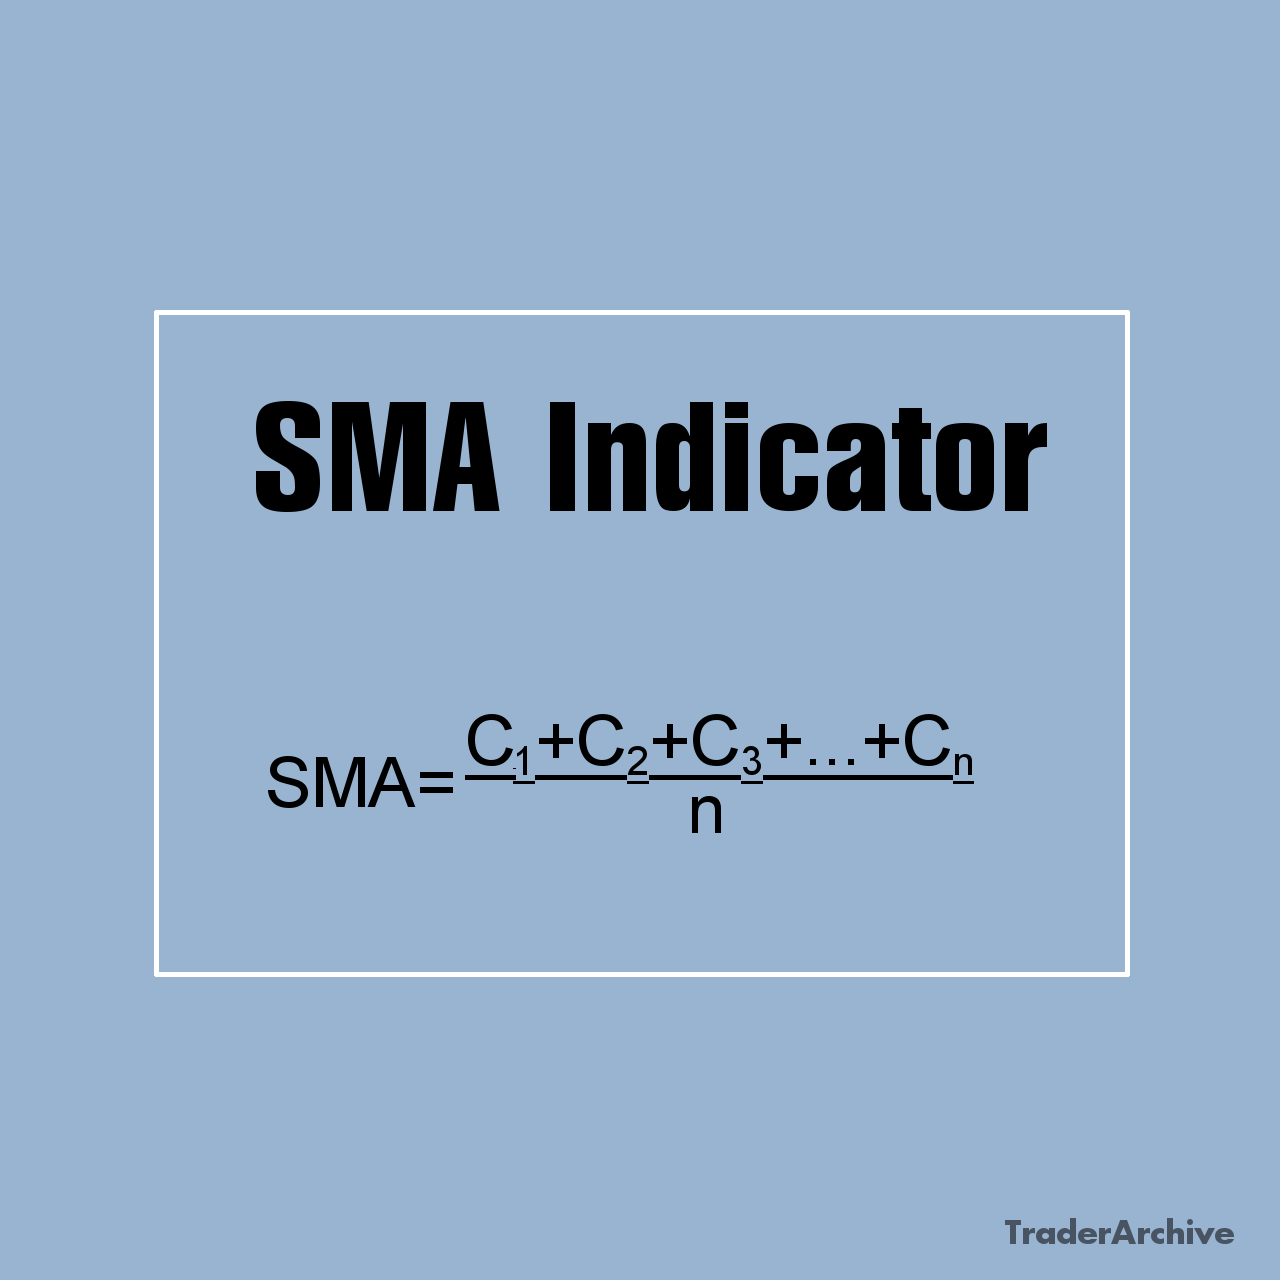
SMA Indicator: Definition, Formula and Excel Template
Simple Moving Average – SMA Indicator: Definition, Formula, and Excel Template for Backtesting Strategies. Essential for traders navigating financial markets.

