Bollinger Bands are a type of statistical chart overlaying securities’ price movements over time. Developed by John Bollinger in the 1980s, Bollinger Bands have become a widely used tool for traders, investors, and analysts. By interpreting the width and position of the bands relative to price action, traders can gain valuable insights into market dynamics and make more informed trading decisions. This thorough manual not only delves into the fundamental principles of Bollinger Bands but also offers a detailed exploration of the most promising strategies leveraging this indicator. Additionally, it provides a practical Excel template for backtesting, enabling traders to refine their strategies with precision and confidence.
The Formula for Bollinger Bands
The indicator consists of three lines – a middle band and two outer bands – that fluctuate according to the volatility of the underlying asset.
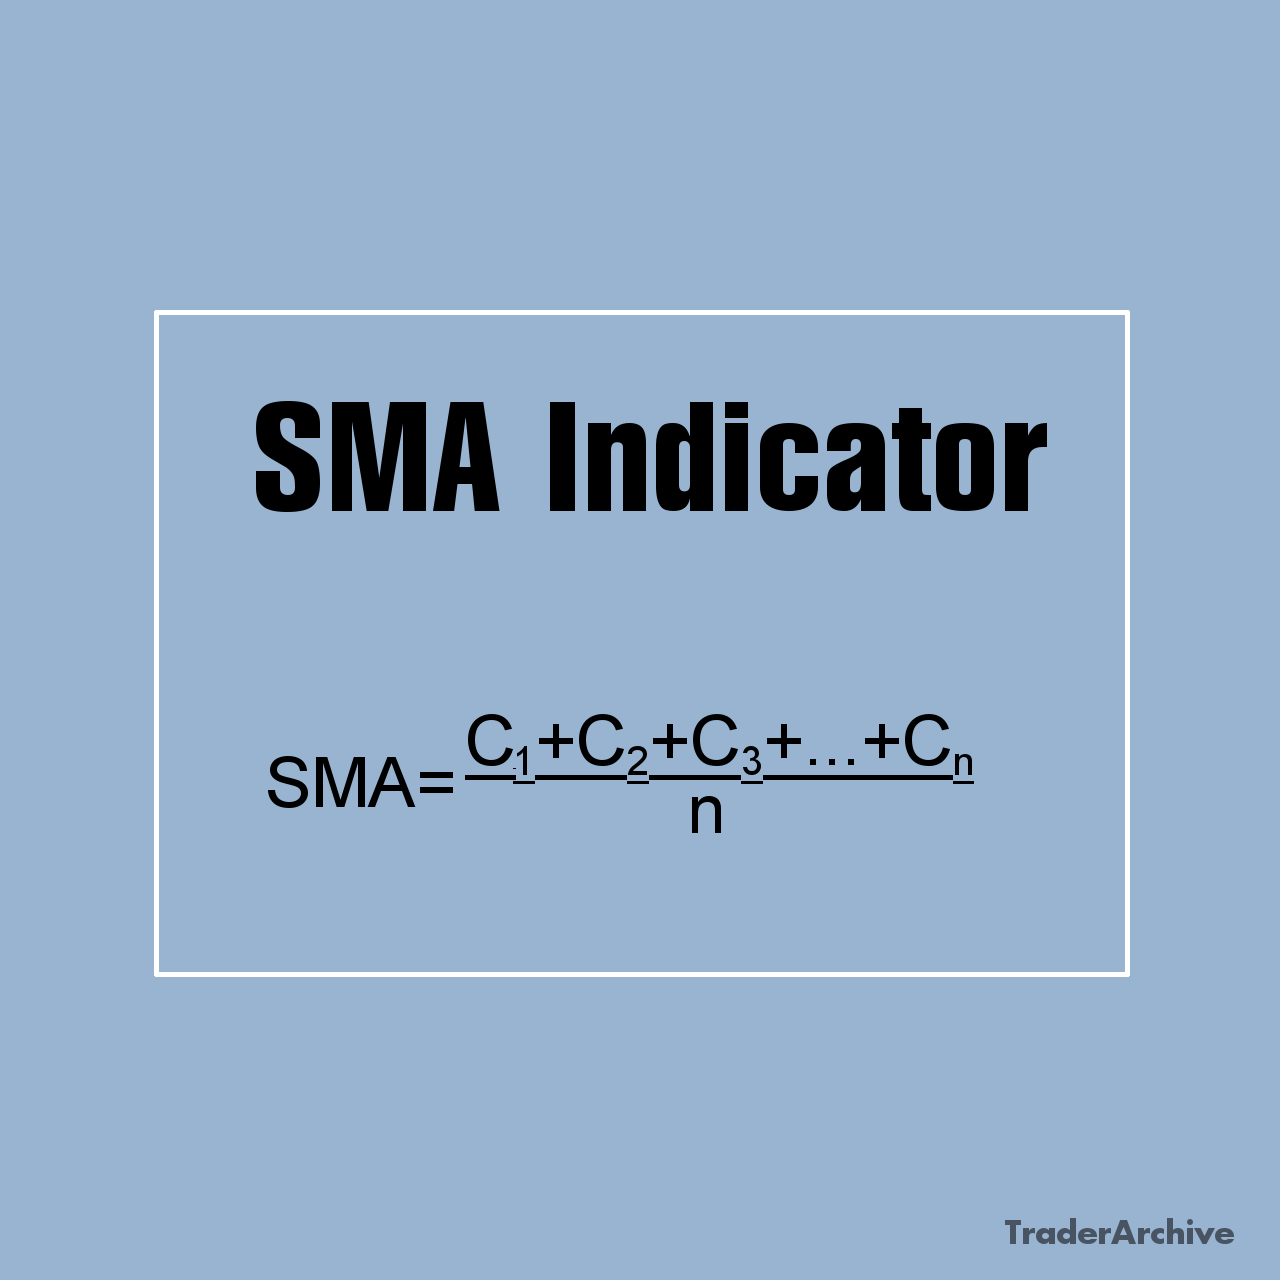
The Middle Band: The middle band represents the simple moving average (SMA) of the asset’s price over a specified period, typically 20 periods. This line serves as the baseline for the indicator and reflects the average price level over the chosen timeframe. Traders often use the middle band as a reference point for assessing the direction of the trend.
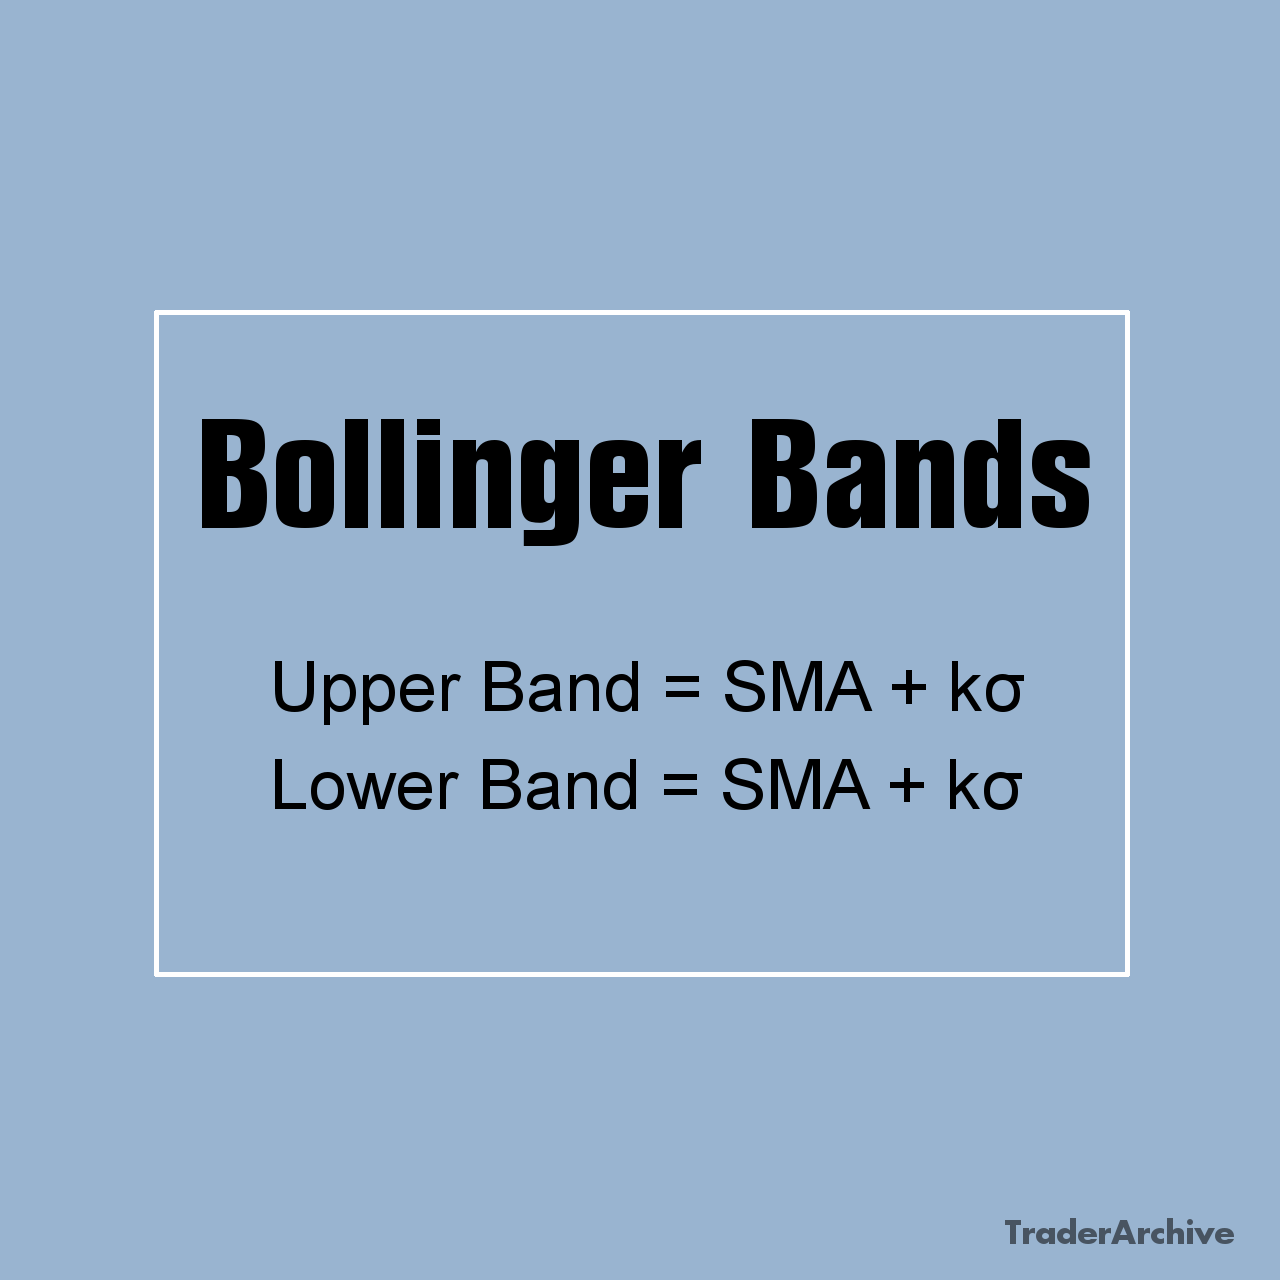
The Upper Band: The upper band is calculated by adding a specified number (k) of standard deviations to the middle band. By default, Bollinger Bands use two standard deviations (k=2), which encompass approximately 95% of the price data within the bands. As a result, the upper band tends to act as a resistance level, indicating potential overbought conditions when prices approach or exceed it.
The Upper Band=SMA+kσ
The Lower Band: Similarly, the lower band is derived by subtracting a specified number (k) of standard deviations from the middle band. Like the upper band, the lower band serves as a support level and signals potential oversold conditions when prices approach or fall below it. Traders often look for buying opportunities when prices touch or breach the lower band.
The Lower Band=SMA-kσ
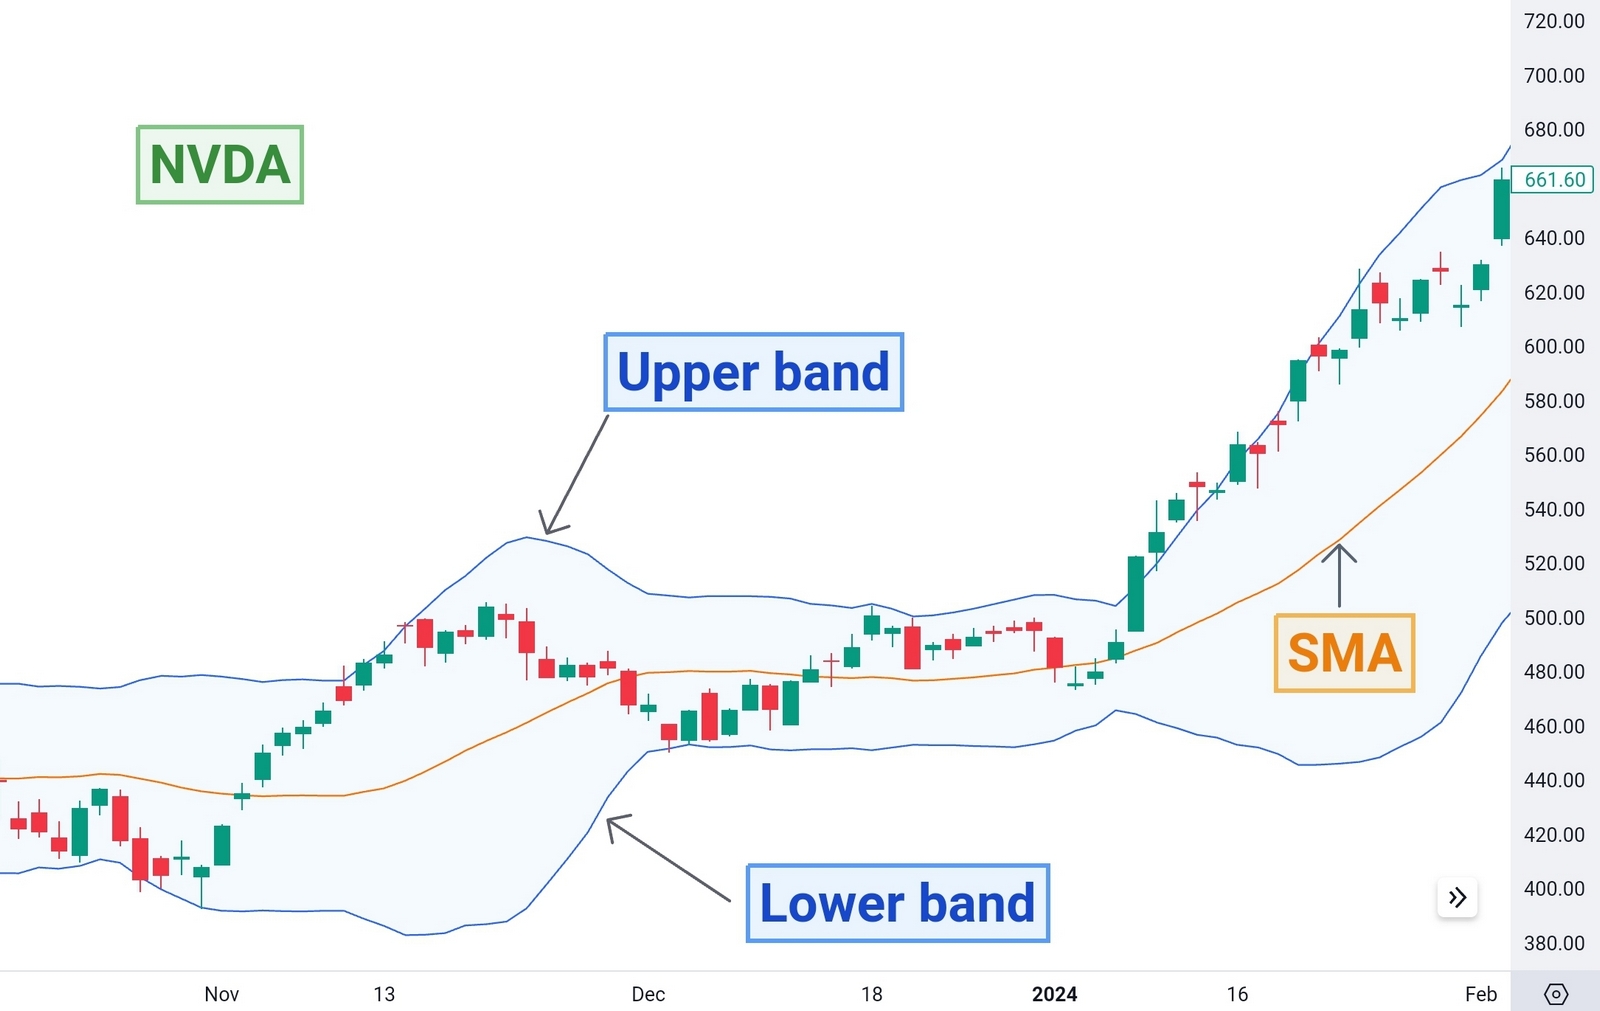
Bollinger bands on NVDA price chart/TradingView
NB! I advise to use Bollinger Bands indicator with Bollinger %b indicator together .
Trading Strategies with Bollinger Bands
The Squeeze Strategy
One popular trading strategy with Bollinger Bands is the Bollinger Band Squeeze. This strategy involves identifying periods of low volatility, as indicated by the narrowing of the bands, followed by a potential breakout. Traders wait for the bands to contract significantly, indicating a period of consolidation, and then anticipate a sharp price movement.
When the bands squeeze together, it suggests that a breakout may be imminent. Traders often use additional technical indicators or chart patterns to confirm the potential direction of the breakout. Once the price breaks out of the consolidation phase and moves above the upper band (in the case of a bullish breakout) or below the lower band (in the case of a bearish breakout), traders may enter a position in the direction of the breakout.
Reversal Strategy
Another common trading strategy with Bollinger Bands is the Bollinger Band Reversal strategy. This strategy involves identifying potential reversal points when the price touches or moves outside the bands. When the price reaches the upper band, it may indicate that the asset is overbought and due for a correction. Similarly, when the price reaches the lower band, it may signal that the asset is oversold and due for a bounce.
Traders look for confirmation signals, such as candlestick patterns or divergences with other indicators, to validate potential reversal points. Once a reversal signal is confirmed, traders may enter a position opposite to the prevailing trend, anticipating a price retracement or reversal.
Breakout Strategy
The Bollinger Band Breakout strategy involves trading the continuation of an established trend. When the price consistently rides along one of the bands, it suggests strong momentum in that direction. Traders wait for a breakout above the upper band in an uptrend or below the lower band in a downtrend to confirm the continuation of the trend.
To minimize false breakout signals, traders often wait for the price to close outside the band and look for confirmation from other technical indicators or chart patterns. Once the breakout is confirmed, traders may enter a position in the direction of the prevailing trend, aiming to ride the momentum until signs of exhaustion or reversal emerge.
Bollinger Bands Divergence Strategy
Divergence between the price and Bollinger Bands can provide valuable trading signals. Bullish divergence occurs when the price forms lower lows while the lower band forms higher lows, indicating weakening bearish momentum and a potential trend reversal. Conversely, bearish divergence occurs when the price forms higher highs while the upper band forms lower highs, signaling weakening bullish momentum and a potential trend reversal.
Traders look for confirmation signals, such as reversal candlestick patterns or oscillators like the RSI or MACD, to validate divergence signals. Once divergence is confirmed, traders may enter a position in anticipation of a trend reversal.
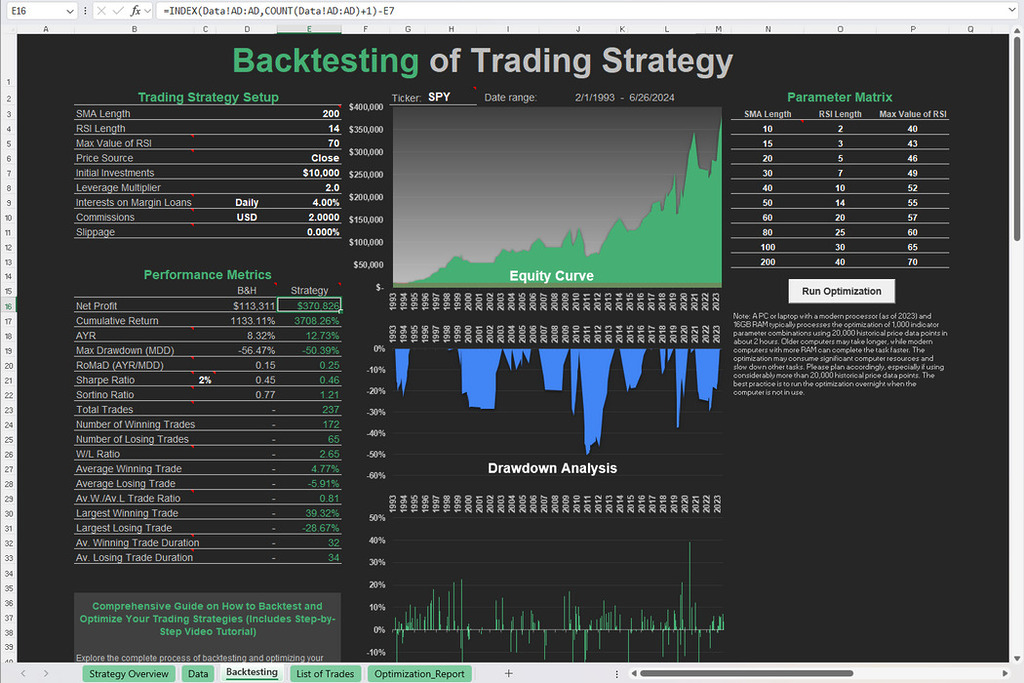
Free Backtesting Spreadsheet
Bollinger Bands and RSI Strategy
As we mentioned above traders often seek to augment their analysis by incorporating signals from different indicators. One popular approach that capitalizes on this principle is the Bollinger Bands and Relative Strength Index (RSI) Strategy which aims to identify potential trend reversals.
Here’s how the strategy typically works:
- Bollinger Bands Confirmation: Traders start by analyzing the Bollinger Bands to assess the market’s volatility and potential trend direction. A common approach is to wait for the price to touch or penetrate one of the bands. If the price touches the upper band, it may indicate overbought conditions, suggesting a potential reversal downward. Conversely, if the price touches the lower band, it may signal oversold conditions, implying a potential reversal upward.
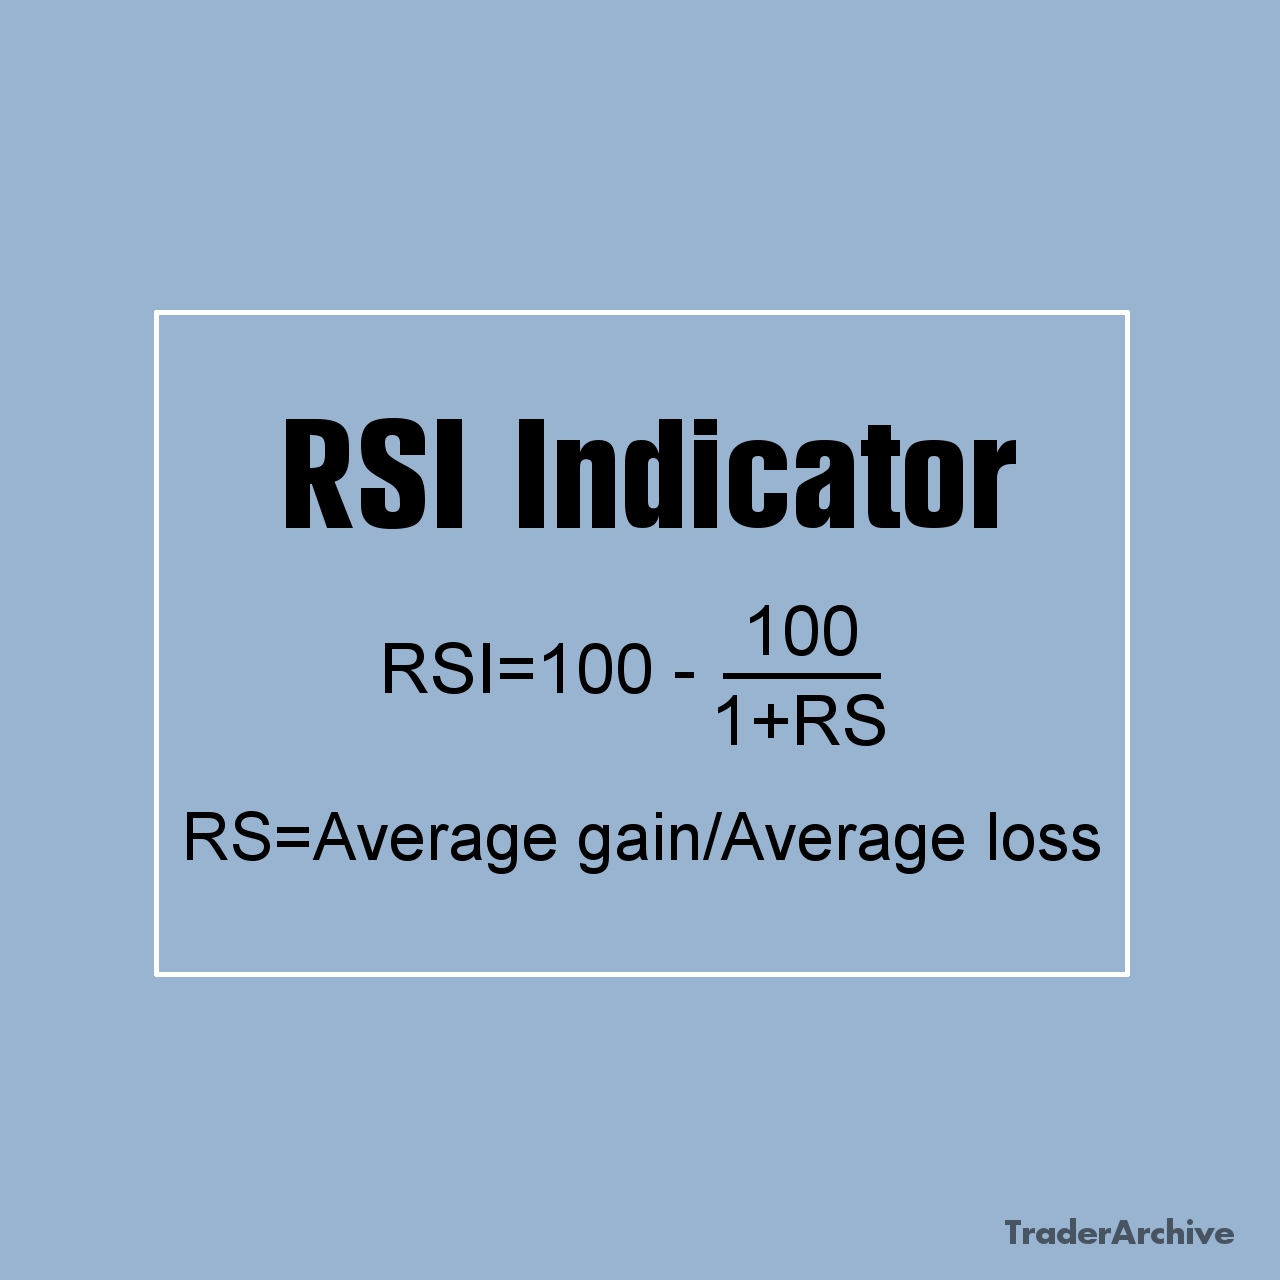
- RSI Confirmation: After identifying a potential reversal signal with the Bollinger Bands, traders look to the RSI indicator for confirmation. The RSI measures the magnitude of recent price changes to assess whether an asset is overbought or oversold. In this strategy, traders typically wait for the RSI to confirm the signal generated by the Bollinger Bands. For example, if the price touches the upper band and the RSI indicates overbought conditions (RSI above a certain threshold, often 70), it strengthens the case for a potential downward reversal. Conversely, if the price touches the lower band and the RSI indicates oversold conditions (RSI below a certain threshold, often 30), it strengthens the case for a potential upward reversal.
- Entry and Exit Signals: Once both the Bollinger Bands and RSI confirm a potential reversal signal, traders may enter a trade in the direction suggested by the indicators. For example, if the price touches the upper band, the RSI indicates overbought conditions, and both indicators confirm a downward reversal, traders may consider entering a short position. Conversely, if the price touches the lower band, the RSI indicates oversold conditions, and both indicators confirm an upward reversal, traders may consider entering a long position.
Double Bollinger Bands Strategy
Double Bollinger Bands strategy is a variation of the traditional Bollinger Bands strategy that incorporates two sets of Bollinger Bands on a price chart. The first set of Bollinger Bands, known as the primary bands, is constructed using standard parameters, such as a 20-period SMA for the middle band and 2 standard deviations for the upper and lower bands. These bands help traders gauge the overall volatility and direction of the market trend. The second set of Bollinger Bands, referred to as the secondary bands, utilizes different parameters compared to the primary bands. Traders often adjust the parameters of the secondary bands to capture shorter-term price movements or to focus on specific market conditions. For example, traders may use a 20-period SMA and 1 standard deviation for the upper and lower bands.
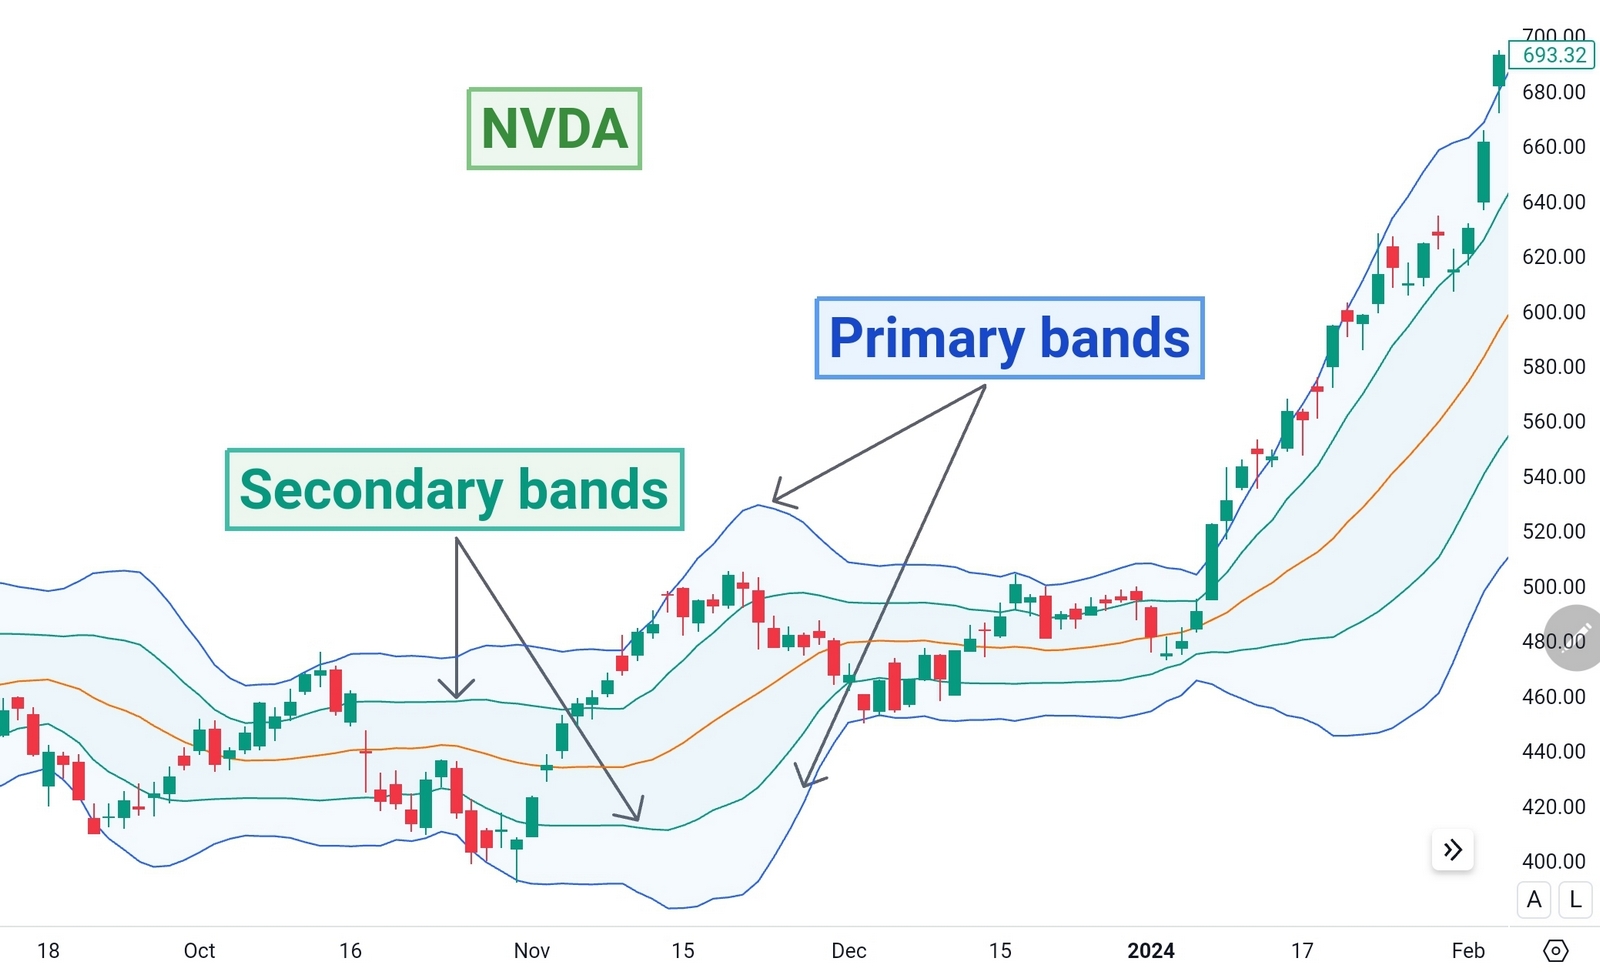
The double Bollinger bands strategy is versatile, capable of accommodating both trend-following and mean reversion approaches depending on prevailing market conditions and the instruments under consideration. Through backtesting, traders can discern which strategy is better suited to their specific circumstances, optimizing their trading decisions for enhanced performance and profitability.
Bollinger Bands Calculation with Excel Template for Backtesting
Backtesting is an indispensable component of refining and validating trading strategies. Utilizing historical data in conjunction with Excel spreadsheets allows traders to simulate their strategies over past market conditions, providing insights into their performance and efficacy. Here’s how you can conduct backtesting with historical data and an Excel spreadsheet for Bollinger Bands strategies:
- Data Collection: The first step in backtesting is acquiring historical price data for the asset or market you’re interested in analyzing. This data typically includes open, high, low, close prices, and volume for each trading period. Various financial websites and data providers offer downloadable historical data that can be imported into Excel for analysis. You can start with Investing.com which provides free historical data in 1D time frame.
- Calculating Bollinger Bands: Once you have the historical price data in Excel, you can calculate Bollinger Bands using simple formulas. The middle band is the moving average of the asset’s price over a specified period, usually 20 periods. The upper band is calculated by adding two standard deviations to the middle band, while the lower band is calculated by subtracting two standard deviations from the middle band. You can download Excel template for Bollinger Bands which was created for your convenience.
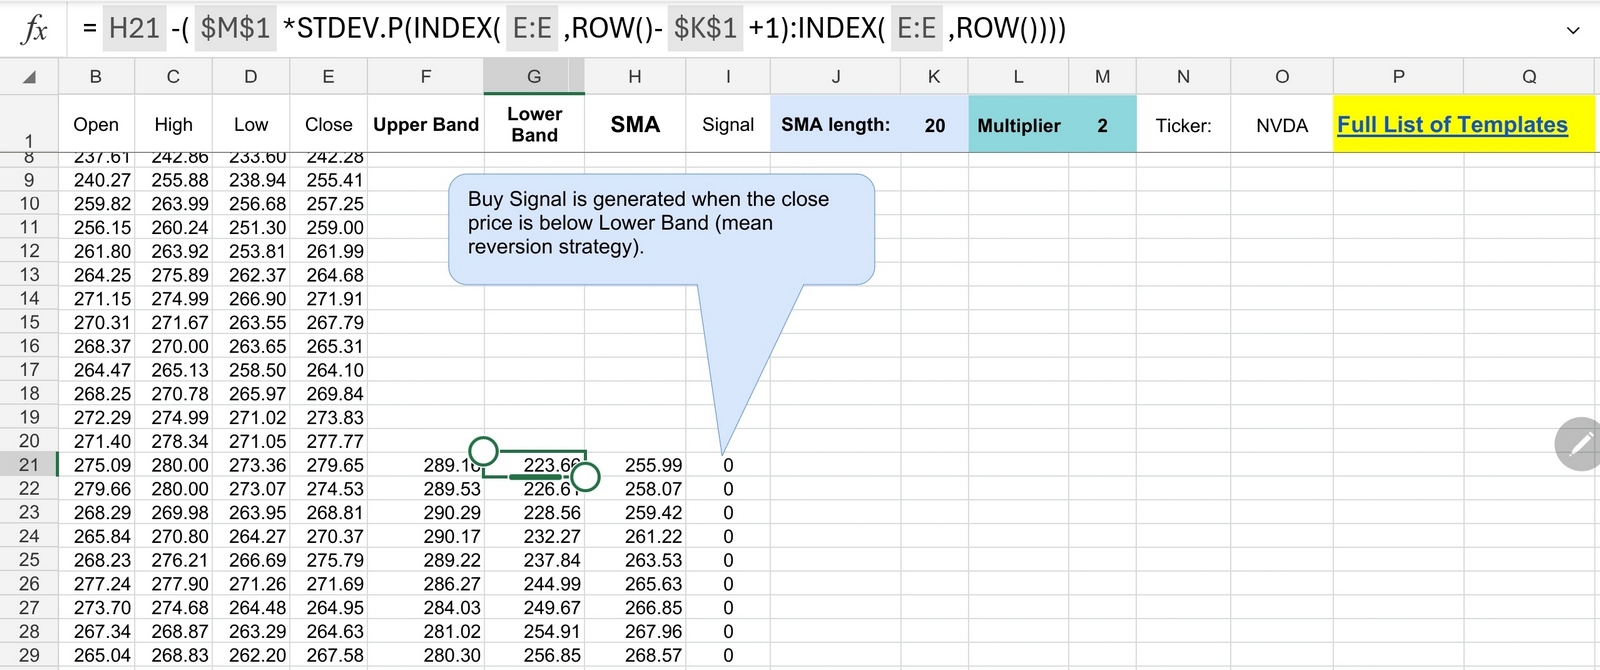
Excel template
- Strategy Implementation: After calculating Bollinger Bands, you can implement your chosen trading strategy in Excel. This may involve identifying entry and exit signals based on Bollinger Band crossovers, price interactions with the bands, or other criteria specific to your strategy. You can use Excel functions and formulas to automate these calculations and simulate trading decisions.
- Performance Analysis: Once your trading strategy is implemented in Excel, you can analyze its performance using various metrics. Key metrics to evaluate include profit and loss (P&L), win rate, risk-adjusted return, maximum drawdown, and others. You can calculate these metrics using Excel formulas and pivot tables to aggregate and summarize the data.
- Optimization and Iteration: After analyzing the performance of your trading strategy, you may identify areas for improvement or optimization. You can experiment with different parameter settings, entry and exit criteria, or risk management rules to enhance the strategy’s performance. By iterating and refining your strategy in Excel, you can develop a more robust and effective trading approach.
- Validation and Sensitivity Analysis: It’s essential to validate your backtested results and conduct sensitivity analysis to assess the robustness of your strategy. You can validate your strategy by comparing backtested results with actual market data or using out-of-sample testing to evaluate its performance on unseen data. Sensitivity analysis involves testing your strategy’s performance under different market conditions or parameter settings to ensure its resilience and adaptability.
By leveraging historical data and Excel spreadsheets for backtesting, traders can gain valuable insights into the performance of their Bollinger Bands strategies and refine them with precision and confidence. However, it’s essential to exercise caution and avoid overfitting your strategy to past data, as market conditions may change over time.
Final Thoughts
Bollinger Bands are a versatile technical indicator that can provide valuable insights into market volatility and potential price trends. Whether used for identifying periods of consolidation, potential trend reversals, or breakout opportunities, Bollinger Bands offer traders a range of strategies to capitalize on market dynamics. By understanding how to interpret and effectively utilize Bollinger Bands in conjunction with other technical indicators and risk management techniques, traders can enhance their decision-making process and improve their chances of success in the financial markets. With proper knowledge and discipline, traders can leverage the power of Bollinger Bands to navigate the complexities of the markets and achieve their trading objectives.
Share on Social Media:


Leave a Reply