Traders are constantly seeking an edge — some insight or strategy that can tip the scales in their favor. But with so many variables at play, how can one confidently develop a trading strategy that stands the test of time? This is where backtesting comes into play. Backtesting is the process of applying a trading strategy to historical market data to see how it would have performed in the past. While it’s true that the future doesn’t always mirror the past, backtesting goes beyond mere historical analysis. It uncovers repeating patterns in human behavior — patterns driven by emotions like fear and greed that are deeply ingrained in the market’s dynamics. By translating these behaviors into quantifiable data, traders can identify patterns and potential weaknesses in their strategies, refining them to be more adaptable to future uncertainties. In essence, backtesting connects the psychology of the market to the science of trading, offering a more robust foundation for strategies that can withstand the complexities of tomorrow.
This guide will walk you through the entire backtesting process, from defining your trading strategy to selecting the right performance metrics, and finally, validating your results.
- Step #1. Define the Strategy
- Step #2. Get Historical Price Data for Backtesting
- Step #3. Define In-Sample Period
- Step #4. Backtesting Setup and the Most Important Performance Metrics
- Step #5. Backtesting and the First Optimization.
- Step #6. Validation with Out-of-Sample Data
- Step #7. Transitioning from Backtesting to Live Trading
- Common Pitfalls in Backtesting
Step #1. Define the Strategy
The first step in backtesting is to define your trading strategy. This involves seting clear rules for entering and exiting trades, determining which indicators or signals to use, specifying the assets to trade, selecting the time frames, and outlining risk management rules like stop-losses.

An example of strategy overview from one of our backtesting spreadsheets.
When defining your strategy, remember that simplicity is key. Strategies with straightforward rules tend to perform better over time. When I first started trading, I built a strategy with 5 different indicators and several additional exit rules. On paper, it looked flawless — my backtests showed incredible returns. But the moment I tried it in live trading, it fell apart. The strategy wasn’t actually capturing any meaningful patterns; it had simply been overfitted to the historical data I used. I had essentially trained it to follow the noise. After learning this hard lesson, I simplified my approach, focusing on just a few key indicators. This is why our backtesting spreadsheets limit the number of parameters to 3-4 — to help traders avoid the same overfitting pitfall I faced early on.
Download a free sample to practice the steps outlined in this guide for better understanding:

Free Backtesting Spreadsheet
Chose Time Frame
When selecting the time frame for your strategy, consider the trade-offs. Lower time frames, such as intraday charts, can offer the potential for more trades and possibly higher profits. At first glance, it may seem that the faster pace and higher frequency of trades could help you achieve your desired returns more quickly. However, intraday trading introduces additional complexity. It often involves dealing with greater noise, requires filtering out irrelevant price movements, and must account for higher transaction costs like commissions and slippage. Despite focusing on short-term moves, intraday strategies are still influenced by broader market trends.
Another challenge with intraday trading is finding reliable historical price data. Sourcing accurate data for these lower time frames is more complex than obtaining daily data. As we move into the next chapter, we’ll explore how to obtain historical data for backtesting, with a focus on the differences between sourcing daily and intraday data.
Step #2. Get Historical Price Data for Backtesting
Reliable historical price data forms the foundation upon which your strategy is tested and refined. While there are various types of data available — such as price, volume, fundamental, and economic data, we will focus primarily on where to find quality price data for backtesting. Here I`ll briefly explain where to get historical price data but if you need more details read dedicated article Historical Price Data for Backtesting: Sources, Quality, Preparation
Where to Get Historical Price Data
Free Sources of Historical Price Data
For traders who are just starting or those who wish to backtest strategies without incurring additional costs, there are several sources of free historical price data. These sources offer daily price data, which is sufficient for many trading strategies, especially those focusing on longer-term trends. We focus here on two of these sources.
Yahoo Finance is one of the most popular and accessible sources of free historical price data, offering historical OHLC (Open, High, Low, Close) data for a wide range of assets, including stocks, indices, ETFs, forex, and cryptocurrencies. However, it no longer provides the option to download data in CSV format, which was once a convenient way to import data into backtesting spreadsheets. Alternatively, Investing.com offers such option for the same wide range of assets.
To access historical data:
- Search for the ticker on Investing.com.
- Click on “Historical Data,” select the desired time interval, and once the historical data is displayed, click on “Download Data.” You will receive the data in a CSV file that can be opened with Excel.

- For data from Investing.com, some additional preparation is required before copying it into backtesting spreadsheets. First, move the “Price” column (you can rename it “Close”) after the “Low” column. Then, select all the data and sort it from oldest to newest.
Paid Sources of Historical Price Data
For traders requiring higher quality, more granular data paid data sources are often the best option. These providers offer data with fewer gaps, more frequency options (such as minute or tick data), and adjustment for corporate actions like splits and dividends:
- FirstRate Data specializes in providing high-quality historical data for equities, ETFs, futures, forex and crypto. They offer data with 1-minute, 5-minute, 30-minute, 1h, 1D timefarmes making it suitable for both intraday and long-term trading strategies.

- EODHD APIs offers a range of APIs that provide historical price data for global stocks, ETFs, mutual funds, indices, and cryptocurrencies. Their intraday data is available mostly in 1-minute intervals.

- Pi Trading offers one-minute intraday historical price data for over 1200 of the most popular and actively traded stocks, ETFs, and indices. Pi Trading has affordable pricing and the quality of its data, what most retail traders need.
- TickData offers high-frequency historical data, including tick-by-tick data, which is essential for high-frequency traders. Their data is well-regarded for its accuracy and completeness.
For a deeper review of historical data providers, you can refer to the ranking conducted by Quantpedia, which can help you evaluate different sources based on factors such as data quality and prices.
It’s important to note that the price of data does not always correlate with its quality. Some data providers may set high prices due to branding, customer service, or other factors unrelated to the data’s accuracy or completeness. Conversely, lower-priced data can sometimes offer excellent value.
Step #3. Define In-Sample Period
When backtesting a trading strategy, it’s essential to distinguish between in-sample and out-of-sample data. In-sample data refers to the portion of historical data used for developing the strategy (training) and optimizations of parameteres, while out-of-sample data is reserved for subsequent testing to validate the strategy’s robustness (which will be covered in more detail in Step #6). The key to successful backtesting is ensuring that the out-of-sample data is not used during the initial strategy training, as this helps prevent overfitting and provides a more realistic assessment of how the strategy might perform in real-world trading.
Selecting In-Sample and Out-of-Sample Periods
The time periods chosen for both in-sample and out-of-sample data should be representative of various market conditions. This means selecting periods that include bull markets, bear markets, and sideways markets, ensuring that the strategy is tested across different environments.

Historical prices 1999-2018 for EUR/USD with in-sample data selection.
When choosing your in-sample period, it’s generally advisable to use a small portion of the available historical data — about 20%. For instance, if you have 20 years of historical data available, you might select a 4-year period that includes distinct market phases. This period will serve as the foundation for developing and refining your trading strategy before it is subjected to out-of-sample testing. These numbers are not precise. It is more important to cover all three market phases in chosen in-sample period even it takes more than 20% of your data.
By using a smaller dataset, you leave more data for the strategy validation and reduce the risk of overfitting. The final evaluation of a strategy’s performance should be based only on out-of-sample data. Therefore, leaving a wide range of historical data with various market conditions for this purpose provides a more reliable assessment of the strategy’s performance.
Step #4. Backtesting Setup and the Most Important Performance Metrics
Backtesting is where your strategy gets its first real test. By running it through historical data, you’ll gain insight into how it would have performed in past markets. But before hitting that “Run Optimization” button, let`s setup your backtest properly. In this step you can refine your strategy or identify areas for improvement.
Backtesting Setup
Before clicking “Run Optimization” in the “Backtesting” sheet of our spreadsheets, you need to configure all parameters in two sections: “Trading Strategy Setup” and “Parameters Matrix.”

Backtesting Setup section of the spreadsheet for EMA crossover strategy with RSI filter. This spreadsheet is included in all our intraday spreadsheets packs.
The Parameters Matrix contains all parameter variations for the strategy’s indicators. When you run the optimization, a macro places each set of values from the Parameters Matrix into the corresponding fields in the Trading Strategy Setup section, calculating the performance metrics for each combination. This process generates the Optimization Report. You can also manually input indicator values into the Trading Strategy Setup section. After each change, the performance metrics will be recalculated automatically.
The rest of the fields in the Trading Strategy Setup section must be set manually and remain unchanged during automatic optimization. Let’s go through these settings in detail:
Price Source
You can choose between “Open” and “Close” as the price source for indicators. Selecting “Open” means that indicators and entry points are based on the opening price of each period. Choosing “Close” bases indicators on the closing price of the period, with trades entering at the opening of the next bar.
24-Hour Market Checkbox
This checkbox allows you to either enable or disable the option to set specific trading hours within a single day. For example, you can define an “Exit Time” to automatically close positions at a set time unless an indicator trigger occurs first. This feature is especially useful for intraday trading in markets like stocks, where traders might want to avoid holding positions overnight.
Some traders prefer to avoid trading during the first 30 minutes or more of a session due to high volatility. The “Start Time” setting allows you to specify when trading should begin, filtering out these initial periods. You can uncheck the box if you’re trading in a 24-hour market but only want to enter and exit trades at certain times.
Useful Tip: Swing traders operating on intraday time frames (e.g., 30-minute, 1-hour, 2-hour, or 4-hour) can also benefit from this feature. If you’re testing strategies on instruments that don’t trade 24 hours a day, checking this box allows you to bypass forced time exits.
This example doesn’t include stop-loss settings, but our other strategies, like those in the RSI 1D+Intraday Pro Pack, offer tools like stop-losses and major trend filters.
Transaction Costs and Interest.
Backtesting results must account for transaction costs (commissions, slippage) and interest accrued from leverage. The last four cells in the Trading Strategy Setup section are dedicated to these factors. Ignoring them can lead to overly optimistic performance metrics, which won’t reflect real-world trading conditions.
Performance Metrics

- Net Profit: The total amount gained after accounting for all losses, transaction costs, and expenses. This metric shows the overall success of the strategy but should be analyzed alongside risk and drawdown metrics to get a complete picture.
- Cumulative Return: The overall percentage gain or loss generated by the strategy over the backtesting period.
- Annualized Yield Return (AYR): The yearly return projection based on the cumulative return over the tested period. Useful for comparing strategies with different time horizons but be wary of relying too much on projections that assume stable market conditions.
- Max Drawdown (MDD): The largest peak-to-trough decline experienced during backtesting. A key measure of risk, it indicates the worst-case scenario for losses and is crucial for understanding the potential capital at risk. For more details read article: Maximum Drawdown in Backtesting: Formula of Your Losses Limit
- Sharpe Ratio: The standard measure of risk-adjusted return, considering the volatility of returns. Higher values suggest better risk-adjusted performance, but it treats all volatility as negative, which can be misleading for certain strategies. For more details read article: The Sharpe Ratio in Backtesting: What Value is Good?
- RoMaD (AYR/MDD): This risk-adjusted measure shows how well the strategy compensates for the drawdowns it incurs.
- Sortino Ratio: An alternative to the Sharpe Ratio that only considers downside volatility, making it more appropriate for strategies where avoiding large losses is prioritized. However, like the Sharpe Ratio, it can be overly sensitive to outlier trades. Analyzing the largest losing trade can provide valuable insights into the ratio’s limitations.
- Total Trades: While more trades provide a better statistical sample, an excessively high number may increase transaction costs and lead to diminishing returns.
- Number of Winning Trades: An important metric but must be considered alongside the average win size and the overall profitability of the strategy.
- Number of Losing Trades: While a low number may seem favorable, it’s essential to understand whether losses are small and controlled or if they occasionally balloon.
- W/L Ratio (Winning to Losing Trades): A higher ratio indicates more consistent performance, but it’s vital to check that the wins aren’t outweighed by larger losses.
- Average Winning Trade: Useful for gauging how much the strategy typically gains per successful trade, but it should be stable rather than reliant on a few big wins.
- Average Losing Trade: Important for managing risk, it highlights the typical cost of a failed trade. Keeping this value low is essential for long-term profitability.
- Average Winning/Average Losing Trade Ratio: This ratio indicates whether your wins are consistently larger than your losses.
- Largest Winning Trade: A very large single winning trade that significantly influences cumulative return should be viewed with caution. It’s important to ensure that the strategy’s success isn’t dependent on a few outsized wins but is instead supported by consistent performance across multiple trades and doesn’t deviate significantly from the average winning trade value.
- Largest Losing Trade: The single largest loss experienced during backtesting. A strategy with a very large losing trade may be exposed to high risks or unanticipated market events. This can severely impact overall performance and should be monitored closely.
- Average Winning Trade Duration: The average time that profitable trades remained open. This helps assess whether the strategy’s gains come quickly or require longer holding periods, influencing risk management and opportunity costs.
- Average Losing Trade Duration: The average time that losing trades remained open. A shorter duration for losing trades usually indicates effective exit rules, minimizing drawdowns and avoiding prolonged losses.
Step #5. Backtesting and the First Optimization.
When you click the “Run Optimization” button, the automatic optimization process begins. This step can be time-consuming, as the macro calculates 1,000 parameter combinations for a strategy using three indicators (e.g., 10x10x10 = 1,000) and 2,401 combinations if four parameters are involved (e.g., 7x7x7x7 = 2,401). The duration of the calculation process depends not only on the number of combinations but also on the number of historical data points and, of course, your computer’s processor speed and RAM.
A PC or laptop with a modern processor and 16 GB of RAM typically handles the optimization of 1,000 indicator parameter combinations using 20,000 historical price data points in about two hours. Keep in mind that this optimization process can consume significant computer resources and may slow down other tasks. We recommend planning accordingly, especially if using a data set larger than 20,000 price points. The best practice is to run the optimization overnight when your computer isn’t needed for other tasks.

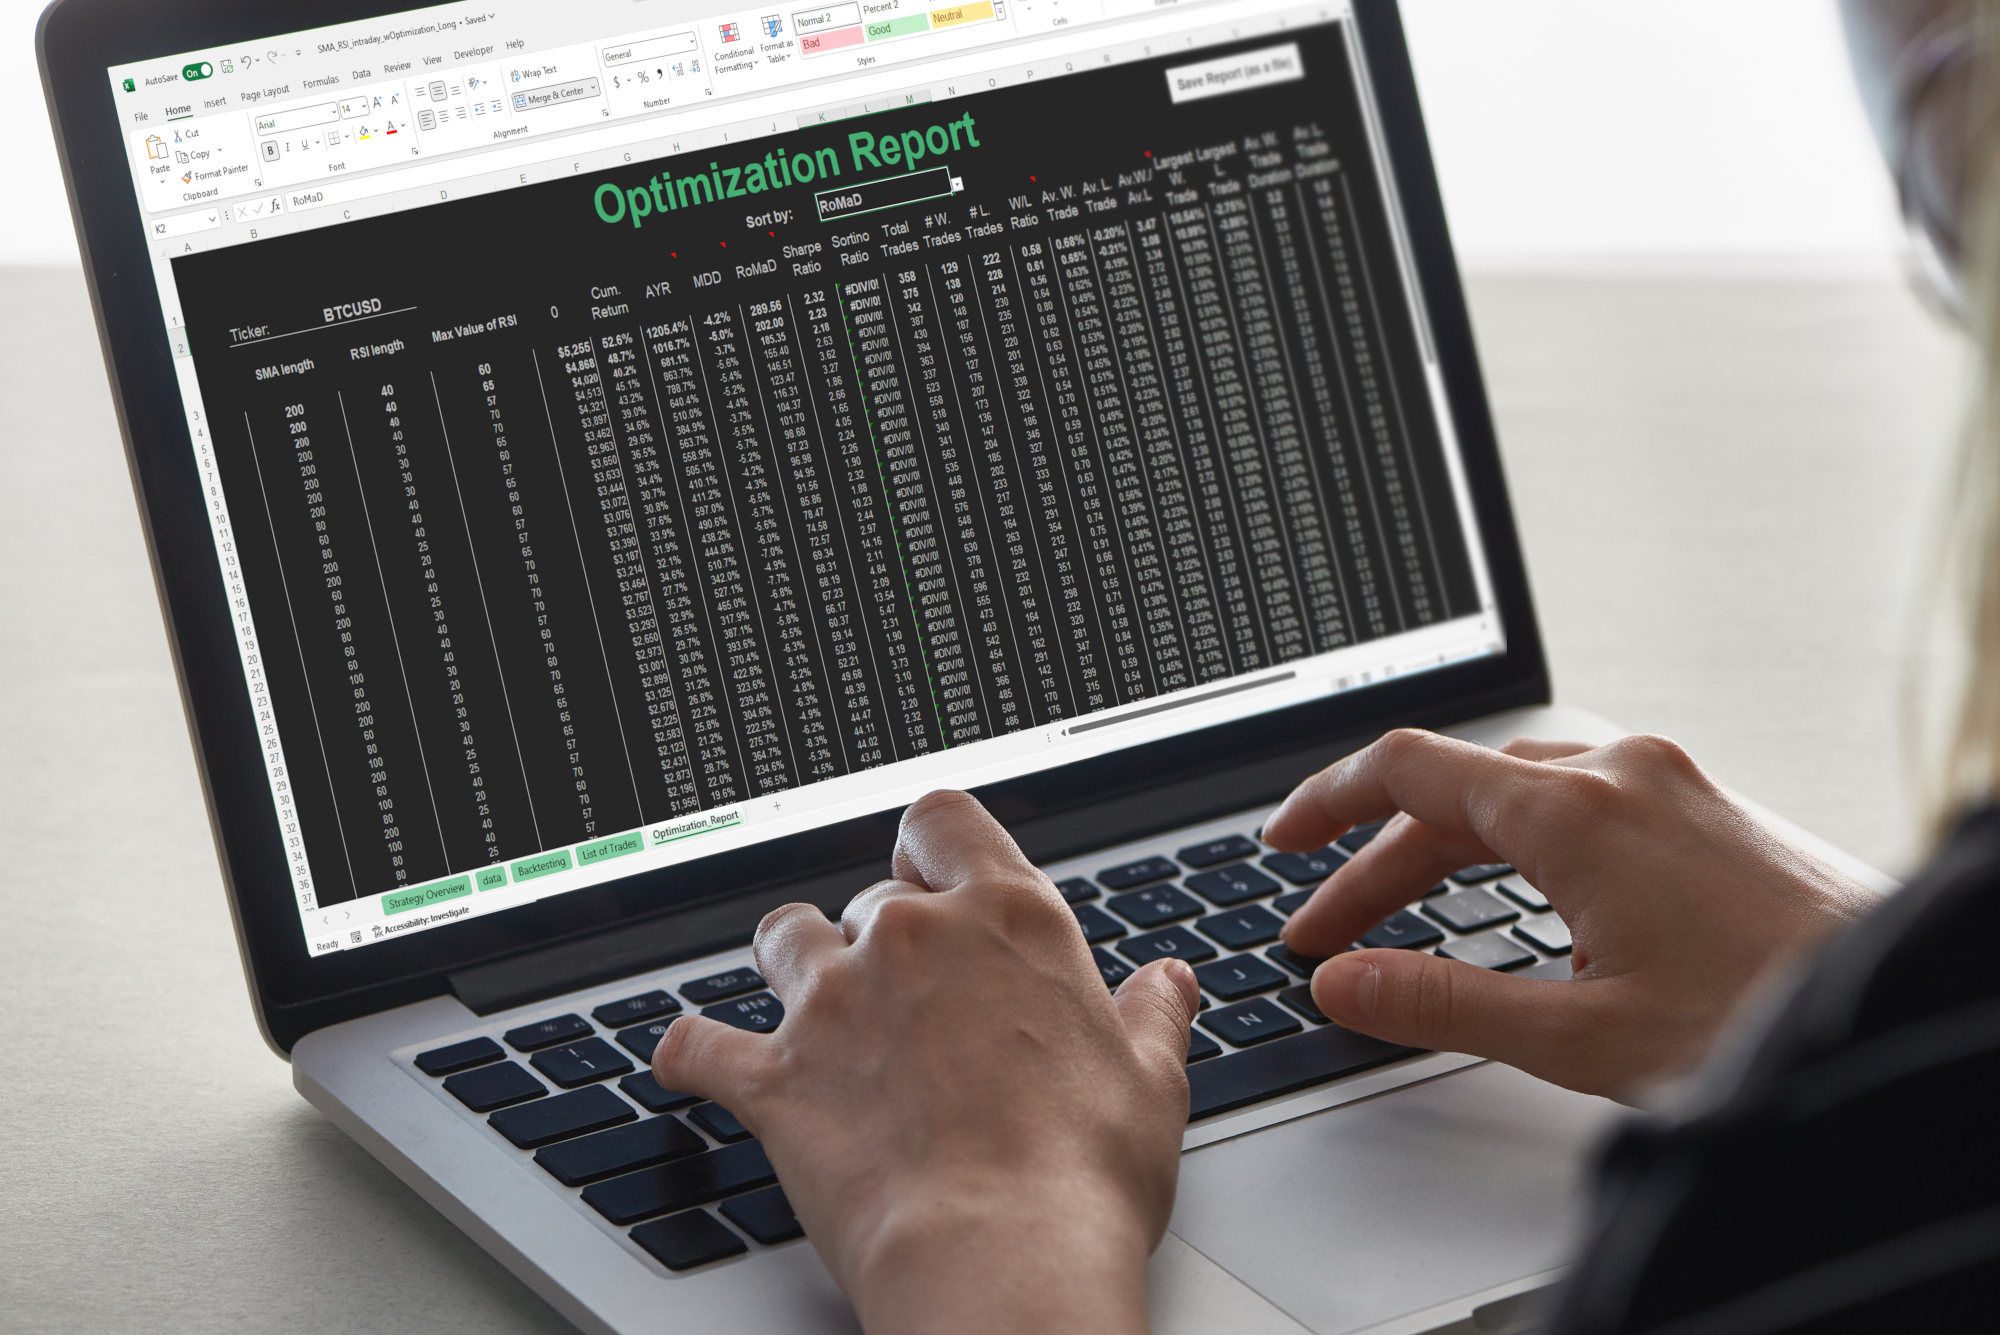
The Optimization Report of EMA crossover intraday strategy which is included in all our intraday packs.
The Optimization Report Analysis.
After the optimization completes, you’ll need to analyze the Optimization Report to evaluate the strategy’s performance. You can sort the report by all 18 performance metrics, such as profitability (Net Return, Cumulative Return, or AYR) or risk-adjusted metrics (RoMaD, Sharpe, or Sortino Ratios).
In general, finding several similar combinations with good performance is more reliable than finding a single combination with the absolute best performance. A single standout combination often fails sensitivity testing and is more likely to underperform during validation. Consistent performance across a range of similar parameters indicates a more robust strategy and suggests a genuine pattern worth further exploration.

Sensitivity Test
A sensitivity test assesses how the strategy’s performance changes when slightly varying the input parameters. Doing this you determine whether your strategy’s success relies on a narrow set of specific conditions (indicating overfitting) or performs well across a broader range of settings.
To conduct a sensitivity test, you should slightly adjust each parameter within a small range around the optimal values identified during the optimization.
A robust strategy will show stable performance even when parameters are modified slightly. If small changes lead to significant drops in performance, the strategy might be overfitted and less likely to succeed in the next validation step.
What to Do if Results Are Unpromising
If the optimization results don’t show promising outcomes, you can revisit the Trading Strategy Setup section and adjust settings before running the optimization again. For intraday strategies, you might change the Start Time or Exit Time or tweak other variables not included in the Parameters Matrix. Experimenting with different setups often reveal better-performing strategies.
Step #6. Validation with Out-of-Sample Data
Once you’ve optimized your strategy using the in-sample data, the next step is validation. Validation involves testing the strategy on out-of-sample data — data that was not used during the initial optimization. This helps ensure that the strategy isn’t just overfitted to the in-sample data but is genuinely robust and capable of performing well under various market conditions.

Only a small percentage of backtested strategies pass out-of-sample validation, and their performance rarely matches the impressive in-sample results. This is a common reality in strategy testing. As you progress, the process may feel like panning for gold — you may sift through many strategies and combinations before uncovering one that truly works. Remember, it’s not a disaster if a strategy fails; it’s just part of the journey. With so many options available, you can always try and explore new strategy.
In this section, we’ll explore two common approaches to validation, each with its advantages and disadvantages. The first approach focuses on finding a stable combination of strategy parameters. Once these parameters are validated, they are used in live trading without further adjustments. The second approach, known as walk-forward optimization, is more complex and involves periodic re-optimization of parameters, both during validation and in live trading.
Constant Combination of Parameters
At this stage, you’ve already used 20% of the historical data for strategy development and optimization. It’s advisable to divide the remaining 80% into several periods equal to the in-sample period. In our case, this results in four periods, each covering 20% of the data. You would then conduct four out-of-sample tests, one for each period. If the strategy loses money in even one of these periods, it raises serious doubts about its robustness. However, if you achieve a 4:0 result in your favor, the strategy can be considered reliable. Flat performance in one or more periods is acceptable but should be weighed carefully as it can affect the overall performance of the out-of-sample tests. Nobody wants to trade a strategy that frequently delivers flat results.
This approach provides confirmation that the strategy can adapt to various market conditions.

The first out-of-sample period can be used for minor additional optimization of the strategy parameters. For example, if you have several promising parameter combinations that offer similar performance metrics, you can use the first out-of-sample period to determine which combination is more reliable.
This approach requires careful selection of the optimal parameter combination during in-sample optimization, as a single failed out-of-sample test can cast serious doubt on the strategy’s viability. Revisiting the optimization results to choose a different parameter combination after a failed out-of-sample test is not recommended, as this often leads to overfitting. Be honest with yourself. Adjusting parameters based on out-of-sample performance creates a strategy that is unlikely to succeed in live trading. If the strategy fails out-of-sample test, it’s better to consider developing a different strategy instead of repeatedly tweaking the parameters. You can also give a strategy another chance after a failed test by trying it with a different ticker.

Another variation worth noting is the random alteration of in-sample and out-of-sample periods. In this method, you can divide the initial 20% of in-sample data into several smaller periods and backtest them separately. Then, choose a parameter combination that performs well across all in-sample periods. The drawback is that randomly selected in-sample periods might not cover all market conditions (bull, bear, and sideways markets).
Walk-Forward Optimization
Walk-forward optimization is an advanced technique that involves continuously moving the in-sample and out-of-sample periods forward in time. After each step, the strategy is re-optimized using the most recent in-sample data, and then tested on the subsequent out-of-sample period. Walk-forward optimization also requires periodic re-optimization during live trading.
This method simulates the real-world process of continually adapting your strategy to new market data, providing dynamic and rigorous validation. Traders often set a fixed schedule for re-optimization, such as monthly, quarterly, or annually. The frequency depends on the strategy and the market. For example, a day-trading strategy might require more frequent re-optimization than a long-term investment strategy. It’s crucial to balance the frequency of re-optimization with the available time and resources. Too frequent optimization might lead to overfitting, where the strategy becomes too tailored to recent data, reducing its generalizability.
This technique is complex and often misunderstood, which is why I will explain it in detail.
Example:
Let’s say you’re testing an exponential moving average crossover strategy using historical price data from 2004 to 2023. You want to use walk-forward optimization to ensure the strategy’s parameters are robust.

Step 1: Optimize on the In-Sample Period
- Use data from 2004 to 2007 to optimize the parameters of the strategy, such as the short and long moving averages.
- For example, you might find that the optimal performance is achieved with a short moving average of 50 periods and a long moving average of 200 periods.
Step 2: Test on the Out-of-Sample Period
- Apply the optimized parameters (50-periods and 200-periods moving averages) to the out-of-sample data from 2008.
- Record the strategy’s performance during 2008 to see how well it holds up.
Step 3: Roll Forward
- Move the in-sample period forward by one year (2005 to 2008) and the out-of-sample period to 2009.
- Re-optimize the strategy using the new in-sample period (2005 to 2008) and then test it in 2009.
- This time you might find that the optimal performance is achieved with a short moving average of 40 periods and a long moving average of 180 periods.
Step 4: Test on the Next Out-of-Sample Period
- Apply the optimized parameters (40-periods and 180-periods moving averages) to the out-of-sample data from 2009.
- Record the strategy’s performance during 2008 to see how well it holds up.
Step 5: Repeat the Process
- Move the in-sample period forward again, now to 2012-2014, and repeat the re-optimization for the next out-of-sample period (2015).
Step 6: Combine All Out-of-Sample Periods
- Combine the out-of-sample performance results from each period to assess the overall effectiveness of the strategy. If the strategy consistently performs well across all out-of-sample periods, it suggests that the strategy is robust and not overfitted to any specific period.
When re-optimizing, ensure parameter changes stay within a reasonable range. For example, if the initial short moving average was 50 periods, a subsequent re-optimization might suggest a slight adjustment to 45 or 55 periods, rather than a drastic change to 20 or 100 periods. Treat each optimization cycle as a continuation, not a reset.
Adaptation vs. Stability
Walk-forward optimization allows a strategy to adapt to changing market conditions by re-optimizing parameters at regular intervals. This helps maintain performance as markets evolve. However, frequent re-optimization increases the risk of overfitting, making the strategy overly tailored to recent data and less reliable in live trading. Additionally, this technique does not allow you to choose in-sample periods with distinct market conditions (bull, bear, or sideways markets).
A strategy with constant parameters is simpler and less prone to being overfitted to specific quirks in the data. Simpler strategies tend to be more robust because they rely on broad, consistent patterns rather than fine-tuned details. If a strategy performs well across multiple out-of-sample periods without re-optimization, it suggests the strategy has captured a more general market inefficiency. The downside is that it may struggle during significant market shifts, where some adaptation would be beneficial.
There is no one-to-go way. The decision between using a walk-forward approach with periodic re-optimization or sticking to a constant parameter set depends on your confidence in the strategy’s core rules and your tolerance for potential market shifts. If you believe the strategy captures a stable, enduring market inefficiency, using constant parameters may be a better way. On the other hand, if you believe your strategy captures temporary market inefficiencies and requires adaptation to this ever-evolving market, it’s better to stick with the walk-forward approach.
Step #7. Transitioning from Backtesting to Live Trading
From Backtesting to Forward Testing (Paper Trading)
Before going live, it’s advisable to test the strategy in a simulated environment using paper trading (forward testing). This allows traders to execute trades in real-time without risking capital, further validating the strategy’s performance. If you use automatic execution tools for trading, this stage is perfect for testing those tools to ensure smooth operation in live conditions.
Further reading: 5 Strong Reasons to Use Paper Trading After Backtesting

Capitalise.ai allows traders to automatically simulate their strategies, and the service is currently free.
From Forward Testing to Live Trading
After successful forward testing, the next step is live trading. Start small and then scale up your strategy by increasing position sizes. However, it’s important to proceed cautiously, ensuring the strategy remains robust at larger scales. Additionally, it’s recommended to continue backtesting the same period as your live trades and compare the results with real trades to identify discrepancies.
During the initial steps of scaling up, you have the opportunity to determine slippage on small trades and evaluate its influence on expected strategy performance. Make sure you gather enough live trading data to estimate average slippage accurately.
Common Pitfalls in Backtesting
In addition to overfitting, common pitfalls include:
Survivorship Bias
Survivorship bias arises when backtests only include data from assets that have survived until the present, excluding those that have been delisted, bankrupt, or otherwise failed. Ignoring these underperforming assets can give a false sense of a strategy’s effectiveness, as it disregards the realities of past market environments where weaker assets might have severely undercut returns.
Ignoring Market Impact
Large trades can move the market, especially with illiquid assets. Backtests often ignore this factor, assuming that the trader’s orders will always be filled at historical prices. In reality, executing large trades can drive prices against the trader, reducing profitability and distorting real-world results.
Confirmation Bias
Confirmation bias occurs when a trader becomes attached to a strategy and overlooks its flaws. This can lead to ignoring red flags, such as inconsistent out-of-sample performance or overly optimistic assumptions. Staying objective and critically evaluating each strategy—even those you favor—is crucial for avoiding this trap. A helpful tip to combat this bias is to stay curious! Continuously explore and backtest various strategies—there are so many out there. What if another strategy outperforms the one you’re currently fixated on?
What is Next?
What if your strategy passes all the steps from optimization to validation and you’re confident that none of the pitfalls mentioned above has derailed your process? The next step is to search for more strategies for diversification. It’s advisable to find additional strategies that are entirely different and operate in different markets—those with the lowest correlation to your primary strategy. When combined, these uncorrelated strategies can deliver better overall performance than when traded separately, helping to smooth out returns and reduce risk.
Share on Social Media:


Leave a Reply