
Breakout trading has captured the attention of traders for years. Why? Because it’s simple, effective, and has the potential to deliver big wins when done right. In this article, we’ll explore what breakout trading is, how it works, how you can master it step by step and how to backtest breakout strategy with Excel.
- What Exactly is a Breakout in Trading?
- Why Do Breakouts Happen?
- N-Day High Breakout Trading Strategy
- Example of N-Day High Breakout Strategy
- Backtesting N-Day Breakouts with Excel
- Breakout Patterns
- The Good and the Not-So-Good of Breakout Trading
- Is Breakout Trading Profitable?
- What is the 5-Minute Breakout Strategy?
- Does Breakout Trading Work in Forex?
- Is There a Best Breakout Strategy?
- What’s the Typical Win Rate for Breakout Trading?
- What is a Candle Breakout Strategy?
- What is the Break and Retest Strategy?
- Best Indicators for Breakout Trading
- How to Use Breakout Strategies for Scalping
What Exactly is a Breakout in Trading?
A breakout happens when the price of an asset moves beyond a significant level of support or resistance. Think of it as a signal that the market is ready to make a bigger move — either up (bullish breakout) or down (bearish breakout). For example, if a stock has been stuck between $50 and $55, breaking above $55 could mean it’s entering a new bullish phase.
Breakouts are exciting because they often attract momentum traders. But don’t be fooled — identifying a breakout is just the beginning. To profit from them, you need to understand their mechanics and avoid common pitfalls.
Why Do Breakouts Happen?
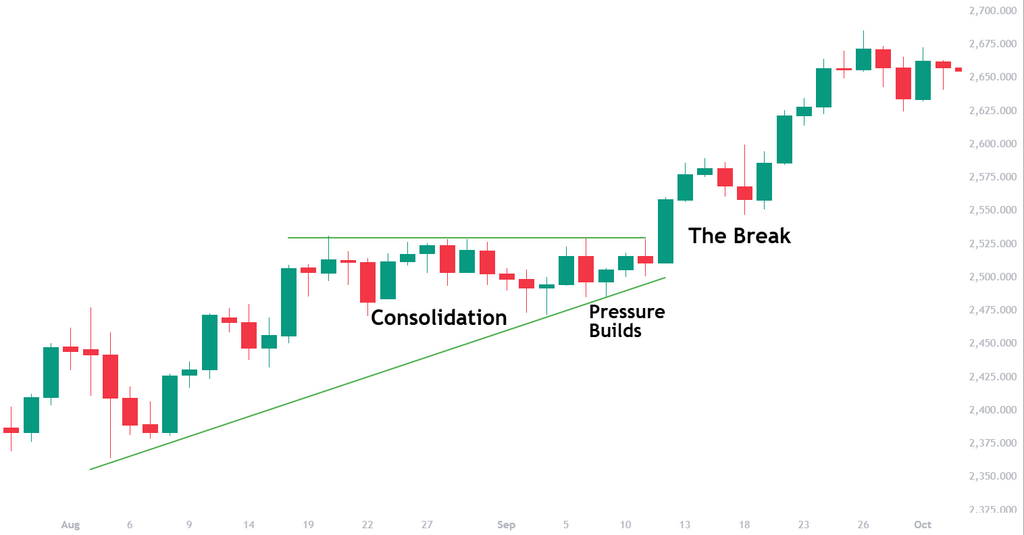
Breakouts occur when there’s a shift in the balance of power between buyers and sellers. Let’s break it down into three stages:
1. Consolidation
Price trades within a tight range as neither side dominates. This phase is marked by indecision, where both buyers and sellers are hesitant to make bold moves. The longer the consolidation, the stronger the eventual breakout tends to be.
2. Pressure Builds
As the price approaches key levels of support or resistance, the tension grows. Orders accumulate near these levels because many stop-loss orders are placed here. While others set buy or sell orders in anticipation of a breakout. This buildup creates a kind of spring-loaded effect.
3. The Break
When one side finally gains the upper hand, the price surges past the key level. This move is often accompanied by a sharp increase in volume, as traders rush to join the breakout or cover their positions.
Breakouts are often triggered by news events, like earnings reports or economic updates. Traders also react to psychological levels, such as round numbers or key highs and lows, which, when breached, can spark buying or selling waves. However, not all breakouts are created equal. Some are driven by genuine market dynamics, while others are the result of temporary volatility or manipulation.
N-Day High Breakout Trading Strategy
The N-day high breakout strategy, also known as the opening range breakout strategy, focuses on identifying and trading breakouts above the highest price over a specified number of days, such as 20-day highs. This method is simple yet effective, especially in trending markets where price tends to continue moving in the breakout direction. A useful tool for illustrating this strategy is the Donchian Channel indicator, which automatically plots the highest high and lowest low over a chosen period.
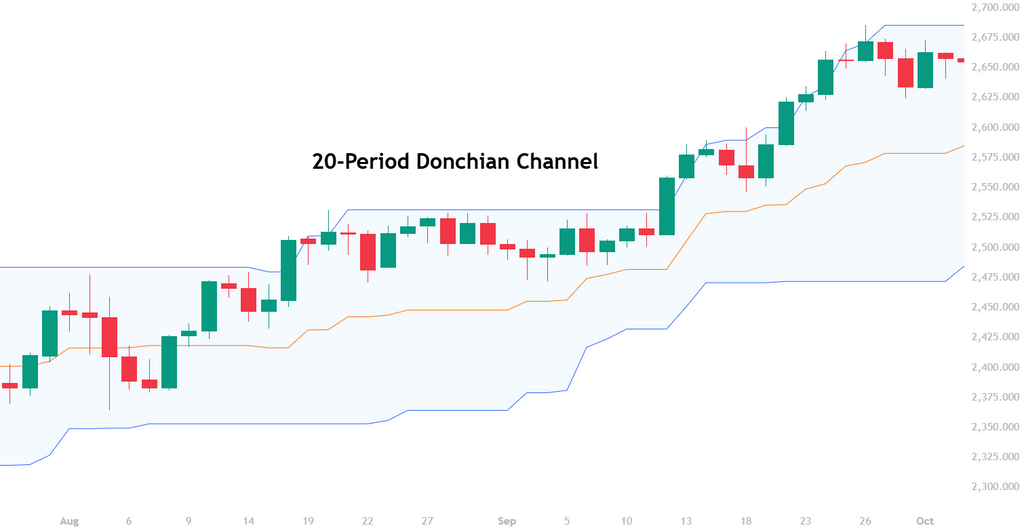
You can download Excel template for Donchian Channel Indicator to test your breakout strategy.
Example of N-Day High Breakout Strategy
- Setup: Identify the highest price over the last N days.
- Entry: Buy when price breaks above this level.
- Stop Loss: Place a stop order to manage cases of false breakouts.
- Take Profit: Use a trailing stop or set a target based on the average range of price movements.
For example, in a 20-day high breakout strategy:
- If the highest price in the last 20 days was $100, you’d enter a buy trade once the price moves above $100.
- Your stop loss might be set at $98, just below the breakout level. Another option is to set stop loss as percentage of initial order amount or even link it to volatility indicators like ATR or Bollinger Bands.
Backtesting N-Day Breakouts with Excel
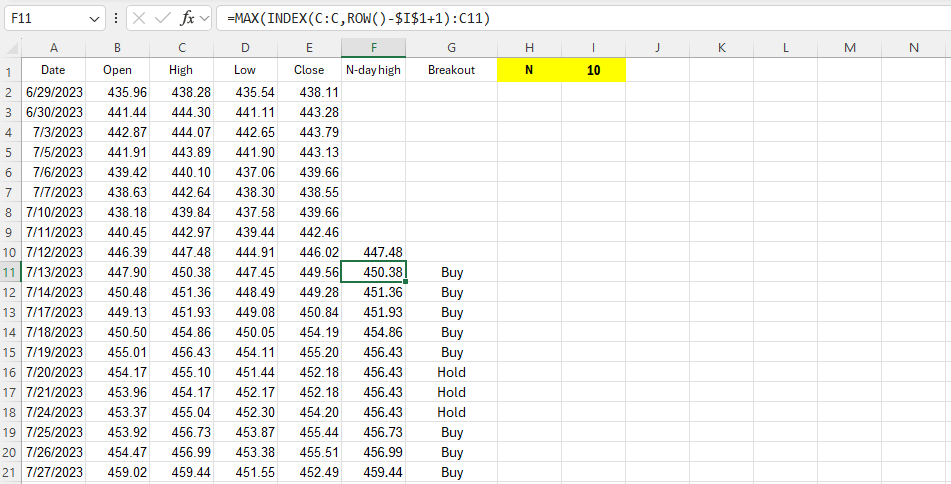
To backtest this strategy using Excel, follow these steps:
- Prepare Historical Price Data. Include columns for date, open, high, low, and close prices.
- Calculate N-Day High. In a new column, use this formula to find the highest price over the last N days: =MAX(INDEX(C:C,ROW()-$I$1+1):C10) This formula allows you to change N-day period dynamically. The length is specified in cell I1.
- Identify Breakouts. Add a column to check if the current price exceeds the N-day high: =IF(C11>F10,”Buy”,”Hold”).
- Track Performance. Add columns to record entry price, exit price, and calculate all performance metrics and charts. You can check how it is done with our free Excel template for backtesting trading strategies.
You can download a simple spreadsheet that better illustrates these steps.
Breakout Patterns
Breakout patterns often form before a strong price moves, helping you spot potential trade opportunities. Triangles, ascending or descending, indicate whether price is building momentum for a bullish or bearish breakout. Rectangles form when price consolidates between horizontal support and resistance. Breakout direction depends on which level is breached. The head and shoulders pattern is a well-known reversal formation.
However, in essence, all these breakout patterns include triangle, where one side represents the breakout level, and the hypotenuse illustrates the market’s willingness to push prices higher or lower before the breakout occurs.
The Good and the Not-So-Good of Breakout Trading
Pros:
- Simplicity. Easy to understand and implement.
- Big Moves. Often captures large price swings.
- Flexible. Works across markets and timeframes.
Cons:
- False Breakouts. Not all breakouts are real. Many fail.
- Patience Needed. Waiting for the right setup can be tedious.
- Volatility. Breakouts can be fast and unpredictable, especially during news events.
Is Breakout Trading Profitable?
Breakout trading can be a great way to make money if you do it right. The trick is spotting solid breakout levels, making sure there’s enough volume to confirm the move, and managing risk with stop-loss orders. Not every breakout will turn into a big winner, but with a disciplined approach, you can catch strong trends.
Success depends on market conditions — breakouts work best in trending markets. Since false breakouts happen, it’s smart to test your strategy and be prepared for some losses. You can find out whether your setup of breakout strategy is potentially profitable or not with backtesing.

Free Backtesting Spreadsheet
What is the 5-Minute Breakout Strategy?
The 5-minute breakout strategy is perfect if you like quick action. It focuses on price movements in short time frames, often at market open. The idea is to mark the highest and lowest points in the first 5 minutes of trading, then enter a trade when the price breaks one of those levels.
Stop-loss orders keep risk in check, and since trades last only a few minutes, quick exits are key. This method is popular among day traders and scalpers who prefer fast-paced trading.
Does Breakout Trading Work in Forex?
Breakout trading is popular in forex, especially for major currency pairs with high liquidity. Forex markets experience frequent breakouts due to news releases and economic updates. You can use breakout strategies to jump in on strong moves when volatility spikes. Some forex-specific breakout strategies include the London breakout, news trading breakouts, and range breakouts.
The London breakout strategy takes advantage of the high volatility during the opening hours of the London trading session. Since false breakouts happen a lot in forex, it is better to confirm breakouts with volume, volatility indicators, or price action signals.
Is There a Best Breakout Strategy?
There isn’t a single “best” breakout strategy — it depends on your style, market conditions and often on instrument you trade. Some traders swear by opening range breakouts, while others prefer trendline breakouts or volatility-based setups. The key is to test different strategies and see what works best for you.
Backtesting helps refine your approach, and using additional tools like moving averages or RSI can improve your success rate but, sometimes, simplicity without any indicator is better. Find a strategy that fits your risk tolerance and trading personality.
What’s the Typical Win Rate for Breakout Trading?
A well-executed breakout strategy should have a win rate above 50% if it’s truly effective. A lower win rate could indicate inefficient use of the strategy’s edge or a lack of real edge altogether. While some traders compensate with a high risk-reward ratio, a consistently strong breakout strategy should produce more winning trades than losing ones. To improve the win rate, it’s essential to optimize not only entry rules but also exit rules.
Properly managing trade exits, whether by adjusting stop losses, trailing stops, or profit targets, can significantly increase the overall effectiveness of a breakout approach. Additionally, filtering breakouts with confirmation signals like volume surges, trend strength, and retests of key levels helps avoid false signals and improves success rates.
What is a Candle Breakout Strategy?
The candle breakout strategy is all about reading price action. Traders look for strong candles that break through key support or resistance levels. For example, a bullish breakout might happen when a big green candle closes above a resistance level with high volume.
Some traders also watch for specific candlestick patterns like engulfing candles or pin bars to confirm breakouts. This strategy works well in both forex and stock markets, especially for traders who prefer price action over indicators.
What is the Break and Retest Strategy?
The break and retest strategy is a safer way to trade breakouts. Instead of entering a trade the moment price breaks a key level, you can wait for price to pull back and retest the level. If the level holds as new support (in a bullish breakout) or resistance (in a bearish breakout), it confirms the breakout and provides a better entry point.
This method helps you avoid false breakouts and improves risk-reward ratios. It’s widely used by both trend traders and price action traders. This strategy was explained in detail by Adam Grimes.
Best Indicators for Breakout Trading
Using indicators can make breakout trading more reliable. Some of the best breakout indicators include:
- Volume – Confirms if a breakout has real strength.
- Moving Averages – Helps spot trends and dynamic support/resistance. The most efficient way is to use major trend filter like 200-day moving average.
- Bollinger Bands – Shows volatility expansion before a breakout.
- RSI (Relative Strength Index) – Helps identify momentum shifts.
- MACD (Moving Average Convergence Divergence) – Confirms trend direction.
How to Use Breakout Strategies for Scalping
Scalping breakout strategies aim to capture small, quick profits. You can use 1-minute or 5-minute charts to find fast breakout opportunities. The key is to spot small price ranges forming on short timeframes, then jump in when the price breaks out.
Since scalpers make multiple trades per session, tight stop-losses and fast exits are a must. This approach works best with high-liquidity assets like forex pairs and major stocks. Many scalpers also use automated trading tools for speed.
Final Thoughts
Breakout trading is simple yet powerful. It gives you a structured way to capitalize on market momentum. But like any strategy, it requires practice, discipline, and a solid plan.
Remember: Breakouts are exciting, but not foolproof. By focusing on key levels, confirming moves, and managing your risk, you’ll put yourself in a strong position to succeed. So get out there, start identifying those breakout opportunities, and let the markets show you what they’ve got!
Share on Social Media:


