

Description
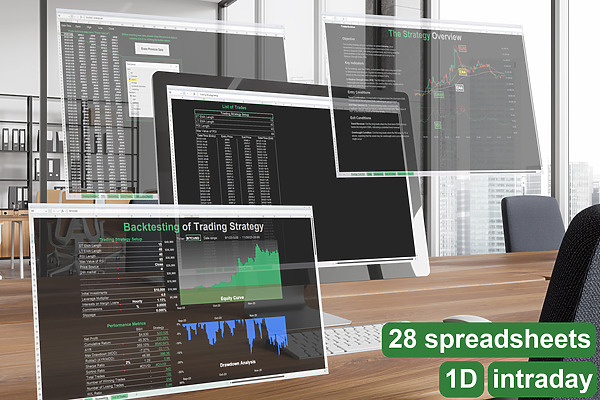
The RSI Daily Essentials Pack provides a focused selection of prebuilt spreadsheets designed specifically for backtesting with 1D (daily) timeframe. Like the RSI 1D Pro Pack, this version includes a variety of RSI-based trading strategies but does not feature the automated optimization tool or support for intraday timeframes. You can manually optimize the strategy parameters, while the pack’s user-friendly design requires only basic Excel skills. Detailed performance metrics such as AYR, Maximum Drawdown, Sharpe Ratio and 15 more metrics allow for in-depth analysis and improvement of your trading strategies.
For more details, see the tutorial video below.
See Tutorial
Content
| # | File Name | Strategy Description |
|---|---|---|
| 1 | 2EMAcross RSI Long | This trading strategy aims to capitalize on upward price movements by entering long trades when a short-term EMA crosses above a long-term EMA, indicating a positive trend, and exiting when the trend weakens or the asset becomes overbought according to the Relative Strength Index (RSI). |
| 2 | 2EMAcross RSI Short | This trading strategy aims to capitalize on downward price movements by entering short trades when a short-term EMA crosses below a long-term EMA, indicating a negative trend, and exiting when the trend weakens or the asset becomes oversold according to the Relative Strength Index (RSI). |
| 3 | BollingerBands-of-RSIcross (ver1) Long | The trading strategy aims to capitalize on short-term price reversals by entering long trades when the Relative Strength Index (RSI) crosses below the lower band of its Bollinger Bands, provided the price is above a long-term Exponential Moving Average (EMA). The trade is exited on the next bar. The strategy is designed for a 1-day timeframe. |
| 4 | BollingerBands-of-RSIcross (ver1) Short | The trading strategy aims to capitalize on short-term price reversals by entering short trades when the Relative Strength Index (RSI) crosses above the upper band of its Bollinger Bands, provided the price is below a long-term Exponential Moving Average (EMA). The trade is exited on the next bar. The strategy is designed for a 1-day timeframe. |
| 5 | BollingerBands-of-RSIcross (ver2) Long | The trading strategy aims to capitalize on short-term price reversals by entering long trades when the Relative Strength Index (RSI) crosses below the lower band of its Bollinger Bands, provided the price is above a long-term Exponential Moving Average (EMA). The trade is exited when the RSI is back inside the Bollinger Bands channel or if a stop loss is triggered. The strategy is designed for a 1-day timeframe. |
| 6 | BollingerBands-of-RSIcross (ver2) Short | The trading strategy aims to capitalize on short-term price reversals by entering short trades when the Relative Strength Index (RSI) crosses above the upper band of its Bollinger Bands, provided the price is below a long-term Exponential Moving Average (EMA). The trade is exited when the RSI is back inside the Bollinger Bands channel or if a stop loss is triggered. The strategy is designed for a 1-day timeframe. |
| 7 | Connors-2P-RSI wSL Long | This strategy is a variant of the Connors 2-period RSI strategy, with the addition of a stop loss for enhanced risk management. The strategy aims to capitalize on short-term price reversals in a mean reversion context by entering long trades when the Relative Strength Index (RSI) drops below a low threshold. It includes a trend filter to ensure entries are made only when the price is above the 200-period Simple Moving Average (SMA), indicating a bullish trend. Trades are exited when the price rises above a short-term SMA, or if the stop loss is triggered. |
| 8 | Connors-2P-RSI wSL Short | This strategy is a variant of the Connors 2-period RSI strategy, incorporating a stop loss for better risk management. The strategy aims to capitalize on short-term price reversals in a mean reversion context by entering short trades when the Relative Strength Index (RSI) rises above a high threshold. A trend filter is applied to ensure entries are made only when the price is below the 200-period Simple Moving Average (SMA), indicating a bearish trend. Trades are exited when the price falls below a short-term SMA or if the stop loss is triggered. |
| 9 | EMA RSI Long | This trading strategy aims to capitalize on upward price movements by entering long trades when a moving average indicates a positive trend and exiting when the trend weakens or the asset becomes overbought according to the Relative Strength Index (RSI). |
| 10 | EMA RSI Short | This trading strategy aims to capitalize on downward price movements by entering short trades when a moving average indicates a negative trend and exiting when the trend weakens or the asset becomes oversold according to the Relative Strength Index (RSI). |
| 11 | SMA RSI Long | This trading strategy aims to capitalize on upward price movements by entering long trades when a moving average indicates a positive trend and exiting when the trend weakens or the asset becomes overbought according to the Relative Strength Index (RSI). |
| 12 | ESMA RSI Short | This trading strategy aims to capitalize on downward price movements by entering short trades when a moving average indicates a negative trend and exiting when the trend weakens or the asset becomes oversold according to the Relative Strength Index (RSI). |
| 13 | SMAofRSIcross EMAtrend-filter Long | The trading strategy aims to capitalize on upward price movements by entering long trades when the Relative Strength Index (RSI) indicates a bullish crossover with its Simple Moving Average (SMA), and exiting when the RSI indicates a bearish crossover or reaches overbought levels. The strategy incorporates a trend filter to avoid trades against the major trend. |
| 14 | SMAofRSIcross EMAtrend-filter Short | The trading strategy aims to capitalize on downward price movements by entering short trades when the Relative Strength Index (RSI) indicates a bearish crossover with its Simple Moving Average (SMA), and exiting when the RSI indicates a bullish crossover or reaches oversold levels. The strategy incorporates a trend filter to avoid trades against the major trend. |
Requirements
- PC or Laptop: Microsoft Excel offers all necessary features exclusively on PC or Mac versions.
- Operating System: Windows 11 or Windows 10 for PC, or Mac OS for Mac.
- Memory: A minimum of 4GB RAM is required, but for optimal performance, 8GB or more is recommended.
- Processor: A modern processor is advised for smoother operation.
- Microsoft Excel: Version 2021 or newer is required. Microsoft 365 is an excellent choice for optimal compatibility and regular updates.
- Historical Price Data: OHLC (Open, High, Low, Close) data is required. Volume data is not necessary since the current spreadsheets do not include volume-based indicators.
Delivery Options
All products on TraderArchive are digital and will be delivered electronically. Upon successful payment, you will receive a download link via email to access your purchase immediately. No physical product will be shipped.
Important: Please ensure the email address you provide is correct. If you do not receive the download link within 24 hours of purchase, please check your spam or junk folder before contacting us for assistance.
Refund Policy
Due to the digital nature of our products, all sales are final. Once the files have been downloaded, we cannot offer a refund, exchange, or cancellation.
If you experience any issues with the product, such as file corruption or download errors, please contact our support team within 14 days of purchase. We are happy to assist you in resolving any technical issues to ensure your product works as intended.


Reviews
There are no reviews yet.