Navigating financial markets demands a keen understanding of various tools and indicators, each offering unique insights into market dynamics. Among these tools is the Moving Average Convergence Divergence (MACD) indicator, known for its versatility and widespread adoption. Developed by Gerald Appel in the late 1970s, the MACD has since become “must have” indicator for technical analysis across diverse asset classes, spanning stocks, currencies, commodities, and cryptocurrencies. In this article I will cover the intricacies of the MACD indicator, its components, calculations by the example of Excel template (downloadable), and more.
Formulas of the MACD Indicator
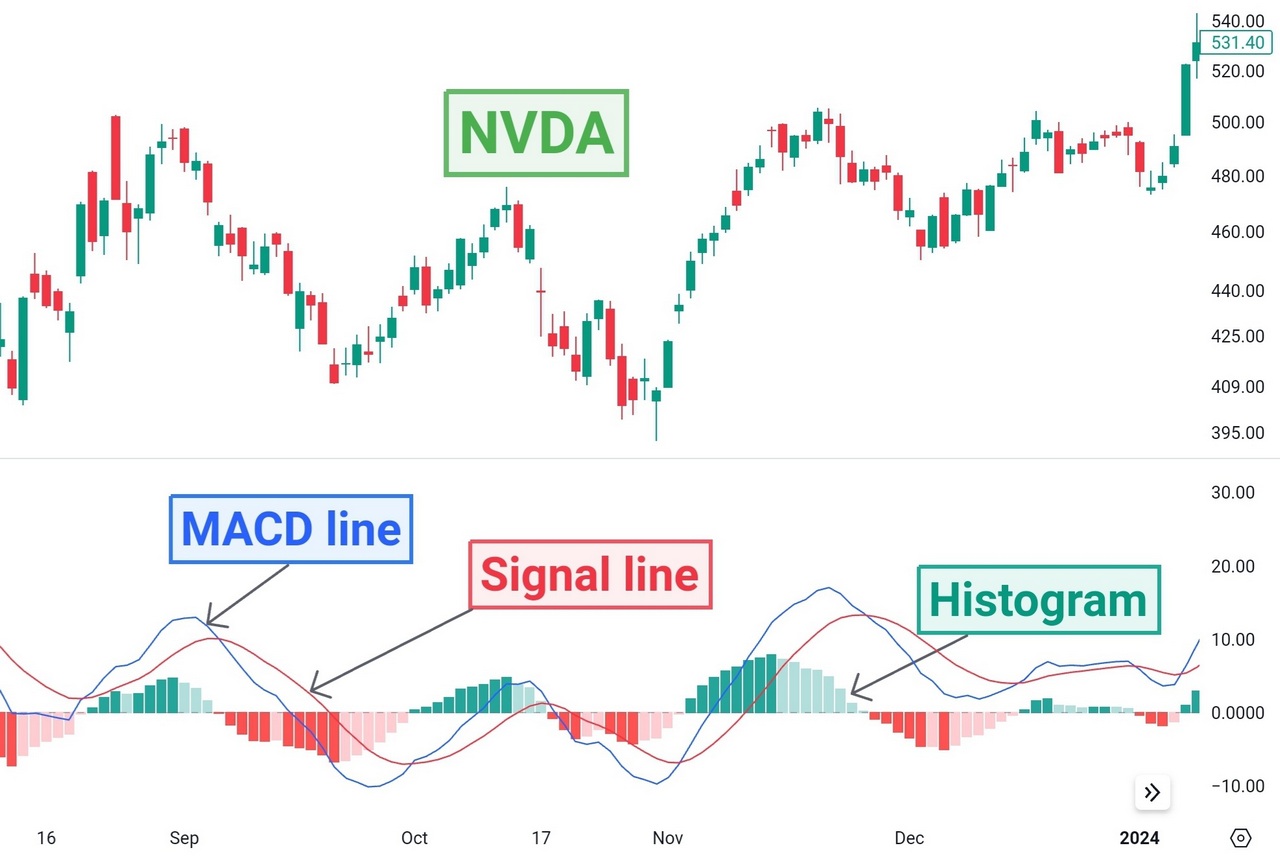
The MACD indicator is a trend-following momentum oscillator that can help you identify potential changes in the direction and strength of a trend. It consists of three primary components.
MACD Line
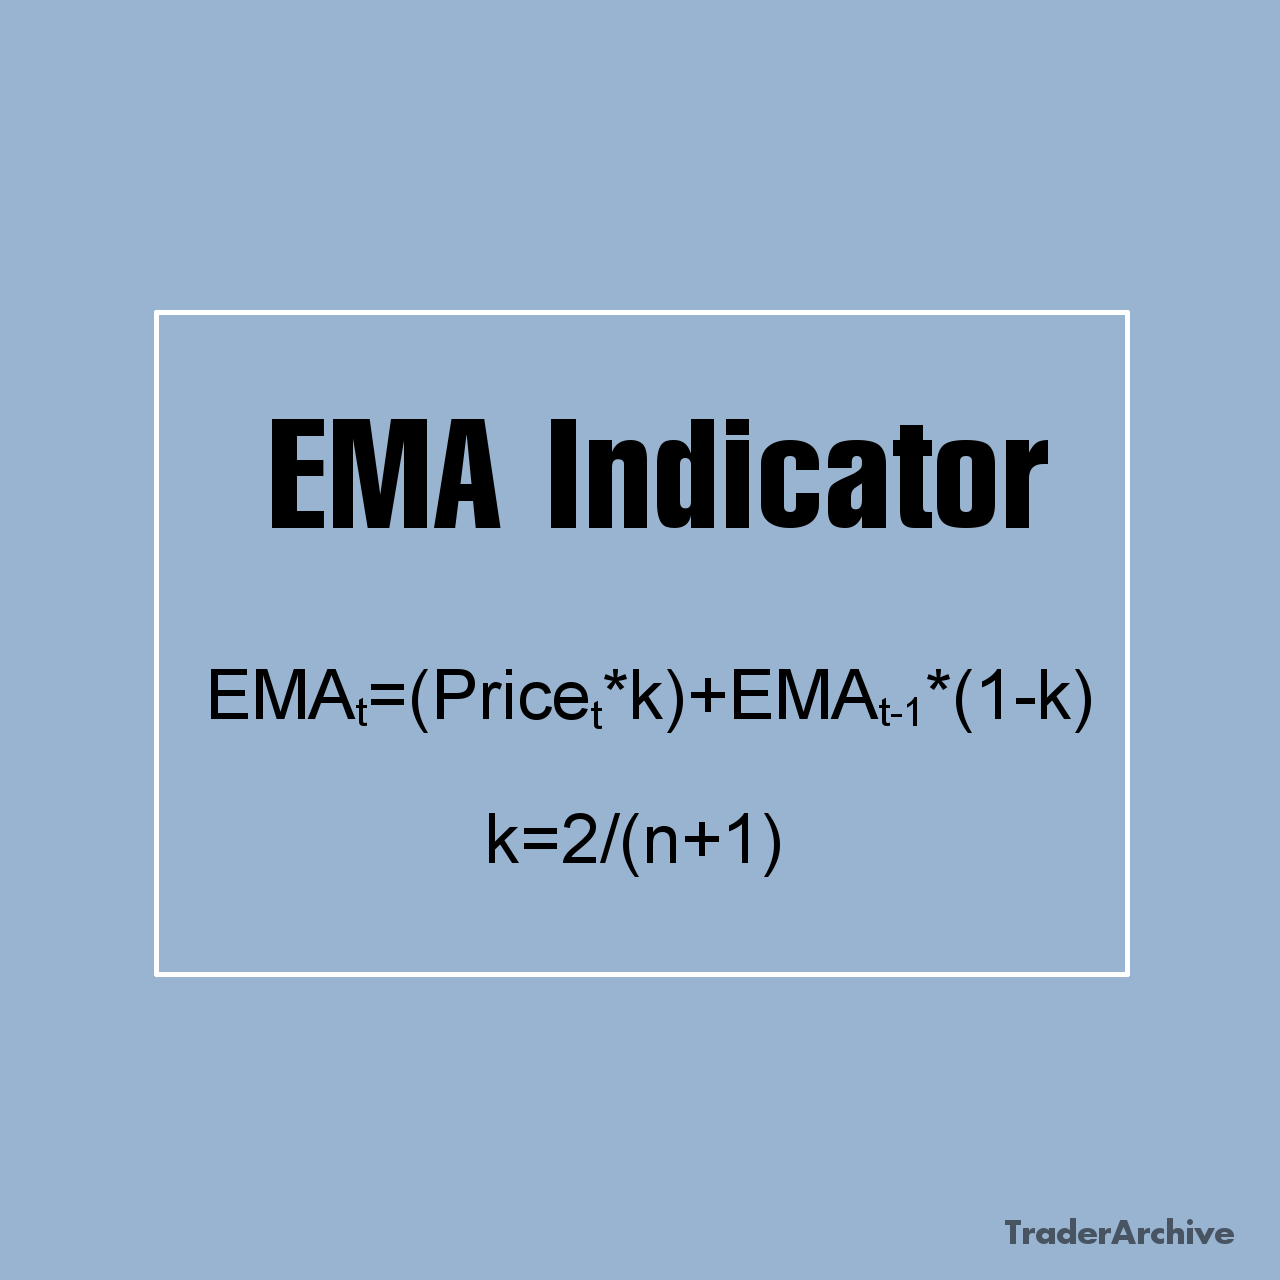
The MACD line is calculated by subtracting the 26-period Exponential Moving Average (EMA) from the 12-period EMA. The resulting line represents the difference between the two EMAs and is plotted on the chart.

Signal Line
The signal line is a 9-period EMA of the MACD line. It acts as a trigger for buy and sell signals, indicating potential trend reversals or continuation patterns.

MACD Histogram
The MACD histogram is derived from the difference between the MACD line and the signal line. It provides a visual representation of the divergence or convergence between the two lines. When the MACD line is above the signal line, the histogram is positive, indicating bullish momentum. Conversely, when the MACD line is below the signal line, the histogram is negative, signaling bearish momentum.
MACD histogram = MACD line – Signal line
Free Backtesting Spreadsheet
Interpreting the MACD Indicator
The MACD indicator offers several signals and patterns that traders can interpret to make trading decisions.
Signal Line Crossovers
One of the most commonly used signals is the crossover between the MACD line and the signal line. A bullish crossover occurs when the MACD line crosses above the signal line, suggesting a potential uptrend. Conversely, a bearish crossover occurs when the MACD line crosses below the signal line, indicating a potential downtrend.
MACD Divergence
Divergence occurs when the price of an asset moves in the opposite direction of the MACD indicator. Bullish divergence occurs when the price forms lower lows, while the MACD forms higher lows, suggesting weakening bearish momentum and a potential reversal to the upside. On the other hand, bearish divergence occurs when the price forms higher highs, while the MACD forms lower highs, indicating weakening bullish momentum and a potential reversal to the downside.
Zero Line Crossovers
Another important signal occurs when the MACD line crosses above or below the zero line. A bullish crossover (MACD line crosses above the zero line) suggests strengthening bullish momentum, while a bearish crossover (MACD line crosses below the zero line) indicates increasing bearish pressure.
MACD Histogram Patterns
Traders also look for patterns and trends in the MACD histogram to identify potential buying or selling opportunities. For example, increasing bullish histogram bars suggest strengthening upward momentum, while increasing bearish histogram bars indicate strengthening downward momentum.
Read the dedicated article for details about MACD strategies.
Limitations of the MACD Indicator
While the MACD indicator is a valuable tool for technical analysis, it is not without its limitations:
- Lagging Indicator: Like most trend-following indicators, the MACD is a lagging indicator, meaning it may not always provide timely signals during rapidly changing market conditions. It is better to use it in conjunction with other leading indicators or price action analysis for confirmation.
- False Signals: As with any technical indicator, the MACD can generate false signals, especially during periods of low volatility or ranging markets. Consider using additional filters or confirmation criteria to avoid getting caught in whipsaw movements.
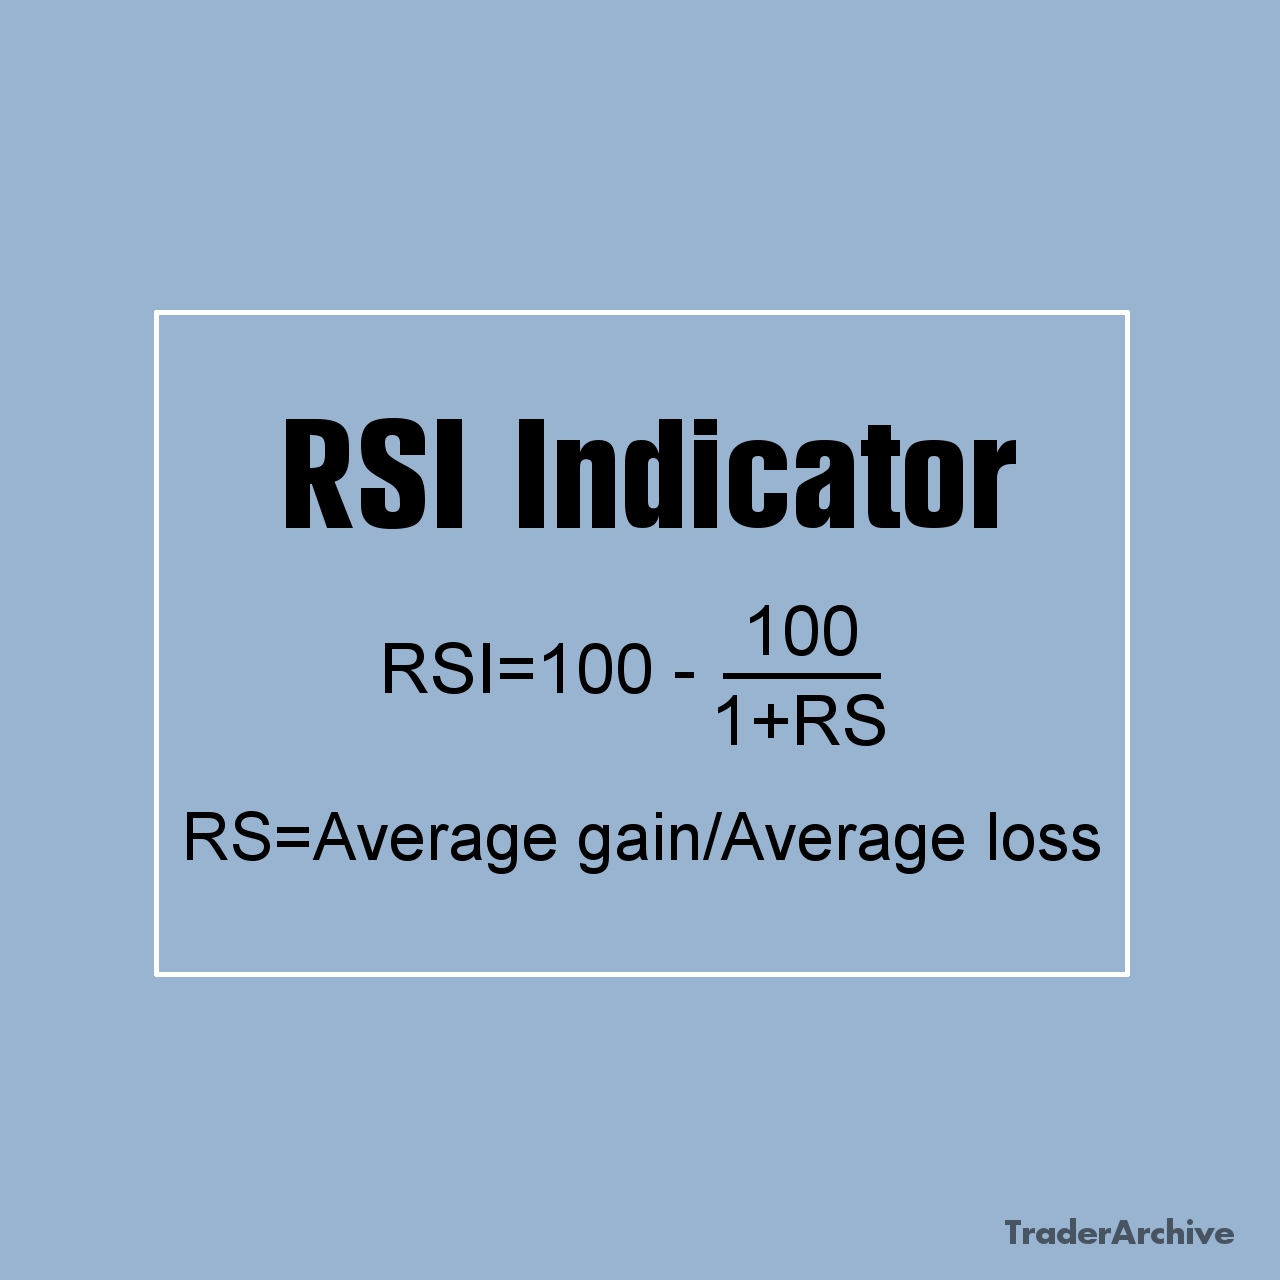
- Overbought and Oversold Conditions: The MACD indicator does not incorporate overbought or oversold conditions directly, unlike oscillators such as the Relative Strength Index (RSI). Be cautious when relying solely on the MACD for identifying potential reversal points and consider using both indicators in conjunction for a more comprehensive analysis.
Backtesting with Historical Data and Excel Spreadsheet
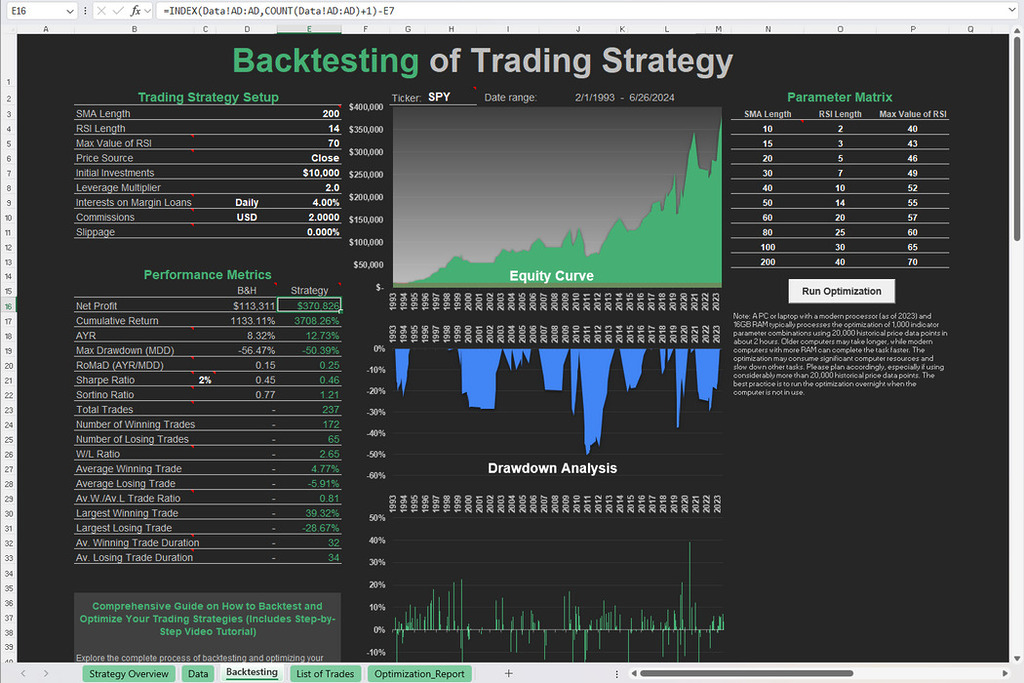
Backtesting is a crucial step in the development and validation of trading strategies. It involves testing a strategy against historical data to assess its performance and profitability. The MACD indicator can be effectively backtested using historical price data to evaluate its efficiency in different market conditions.
Historical Price Data Collection
Collecting accurate and comprehensive historical price data is essential for meaningful backtesting with the MACD indicator. Historical data typically includes open, high, low, close prices, and volume for each trading period (e.g., daily, hourly, or minute intervals). You can obtain this data from a variety of sources, including financial websites, data providers, or directly from trading platforms. You can start with Investing.com which provides free historical data in 1D time frame. It’s crucial to ensure that the data is clean, free from errors or gaps, and covers a sufficiently long time frame to capture various market conditions.
Calculation of MACD Values
Once historical price data is in place, the next step is to calculate the MACD values using Excel spreadsheet. Implementing formulas to compute the MACD line, signal line, and histogram for each period allows traders to visualize and analyze the indicator’s behavior over time. You can download Excel template for MACD indicator which was created for your convenience.
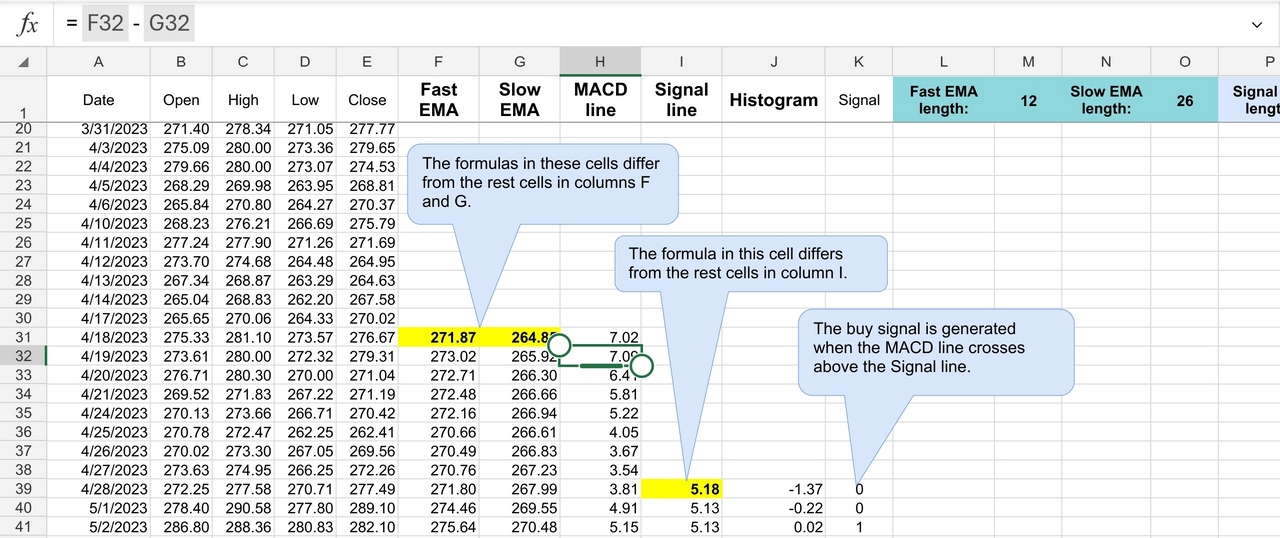
- To calculate the MACD line, subtract the longer-term EMA (e.g., 26-period) from the shorter-term EMA (e.g., 12-period). The result represents the difference between the two EMAs and is plotted as the MACD line on the chart.
- The signal line is then derived by applying an additional smoothing mechanism, typically a 9-period EMA, to the MACD line. This signal line acts as a trigger for buy and sell signals, helping traders identify potential trend reversals or continuation patterns.
- Finally, the MACD histogram is computed by taking the difference between the MACD line and the signal line. Positive histogram bars indicate bullish momentum when the MACD line is above the signal line, while negative bars suggest bearish momentum when the MACD line is below the signal line.
Analyzing Backtest Results
After conducting backtests with the MACD indicator, the next step is the analysis of the results to determine the viability of your trading strategies. Consider the following factors:
- Profitability: Measure the profitability of each strategy by calculating key performance metrics such as total return, average return per trade, win rate, and maximum drawdown.
- Risk Management: Evaluate the risk-adjusted returns of your strategies by considering metrics like the Sharpe ratio, which measures the risk-adjusted return relative to the volatility of the strategy.
- Robustness: Assess the robustness of your strategies by testing them across different time periods, asset classes, and market conditions. Look for consistency in performance and adaptability to changing market dynamics.
Final Thoughts
This article has served as a comprehensive guide through the labyrinth of the MACD indicator, unraveling its components, calculations, interpretation, and practical applications. Yet, it’s vital to acknowledge the limitations inherent in any tool. The MACD, while powerful, remains a lagging indicator susceptible to false signals. As such, It is better to use it alongside other indicators, like RSI, for a more holistic analysis. Through the process of backtesting with historical data and Excel spreadsheet analysis, you can evaluate the efficiency of your strategies, measuring profitability, managing risk, and ensuring robustness across varied market conditions.
Share on Social Media:
FAQ
What does the MACD indicator do?
The MACD consists of three main components: the MACD line, the signal line, and the histogram. By analyzing the relationship between these components, the MACD helps you gauge momentum, identify trend reversals, and generate buy or sell signals.
What does 12 26 9 mean on MACD?
12 represents the number of periods used to calculate the faster exponential moving average (EMA), 26 represents the number of periods used for the slower EMA, and 9 represents the number of periods used for the signal line, which is a moving average of the MACD line.
What is a good MACD signal?
1) When the MACD line crosses above the signal line, suggesting a potential uptrend. 2) When the MACD line crosses below the signal line, indicating a potential downtrend. 3) When the MACD line crosses above or below the zero line, signaling a shift in momentum. 4) When the price of an asset moves in the opposite direction of the MACD indicator, indicating a potential trend reversal.
When should I use MACD?
You can use the MACD indicator in various ways, depending on their trading style and objectives. MACD is commonly used for trend following, momentum trading, and identifying potential trend reversals.
How accurate is MACD?
The accuracy of MACD signals can vary depending on market conditions, asset class, and the specific parameters and strategies employed. While MACD can provide valuable insights into market trends and momentum, it may generate false signals, especially during choppy or range-bound markets. Backtesting with historical data can help assess the performance and reliability of MACD-based trading strategies over time.
Leave a Reply