In the realm of technical analysis, traders utilize a plethora of tools and indicators to aid their decision-making process. Among these tools, the average true range (ATR) indicator stands out as a powerful measure of volatility. Originally introduced by J. Welles Wilder Jr. in his book “New Concepts in Technical Trading Systems” in 1978, the ATR indicator has since become a staple in the toolkit of traders across various financial markets. This article aims to explain how the ATR indicator works, cover its applications in trading strategies, and how ATR is calculated in Excel spreadsheets.
Understanding the ATR Indicator
Before delving into the specifics of the ATR indicator, it is essential to grasp the concept of volatility. Volatility refers to the degree of variation in the price of a financial instrument over time. High volatility implies wide price swings, while low volatility suggests relatively stable price movements.
The average true range is a technical analysis indicator designed to measure market volatility. Unlike other oscillators or trend-following indicators, the ATR does not provide directional signals. Instead, it quantifies volatility, helping traders gauge the potential for price swings within a given time frame. A higher ATR value suggests greater volatility, indicating wider price fluctuations and potentially more significant trading opportunities. Conversely, a lower ATR value signifies reduced volatility, implying relatively stable market conditions with smaller price movements.
Calculation of ATR
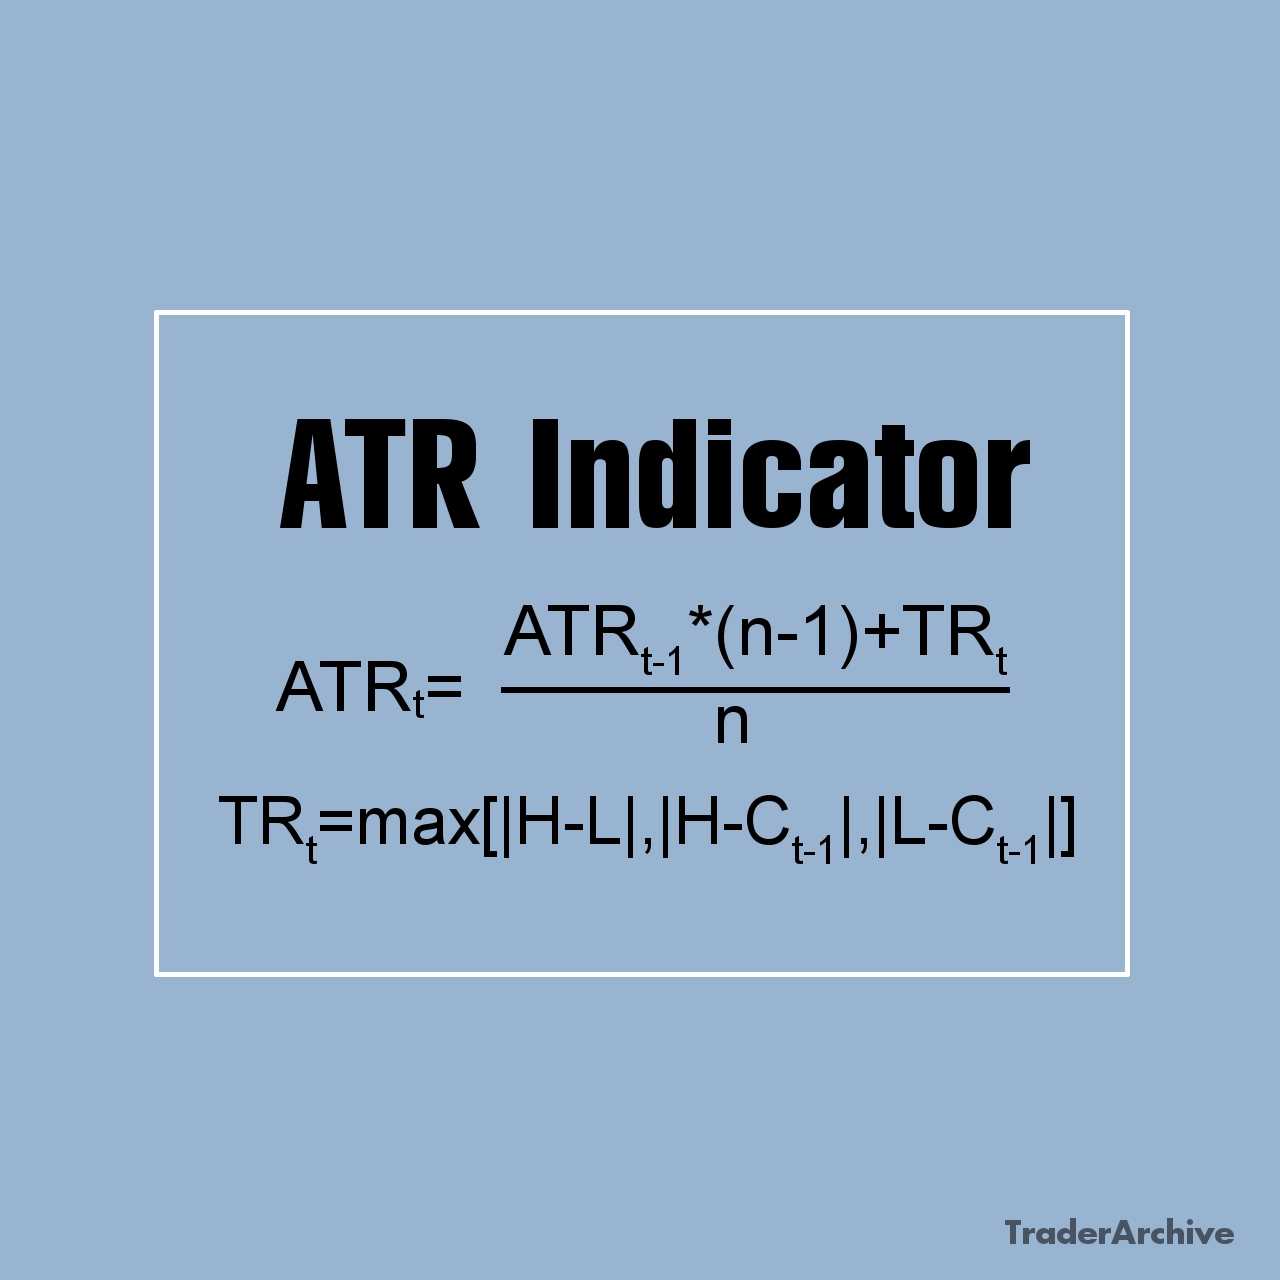
The ATR indicator is designed to measure the average range between the high and low prices of an asset over a specified period. Unlike other technical indicators that focus solely on price action, the ATR incorporates both price gaps and limit moves into its calculation, providing a more comprehensive view of volatility. The formula for calculating the ATR is relatively straightforward:

Where:
- ATR is the average true range
- n is the number of periods or days
- TRt is the true range for each period, calculated as the maximum of: high – low, absolute value of (high – previous close), absolute value of (low – previous close)
Since the ATR formula involves iterative calculation, you need to find the initial ATR value:

Applications and Strategies Utilizing ATR Indicator
The average true range is a versatile technical indicator with numerous applications across various trading strategies. Its ability to measure volatility provides traders with valuable insights into market conditions, facilitating more informed decision-making. Below, we explore some of the most common and advanced strategies that utilize the ATR indicator.
Setting Stop Loss Levels
A fundamental application of the ATR is in setting stop-loss levels. By incorporating the ATR value into their risk management strategy, traders can adjust stop-loss orders based on market volatility. For instance, a trader may set stop-loss at a multiple of the ATR away from entry point, ensuring that the stop level adapts to changes in volatility.
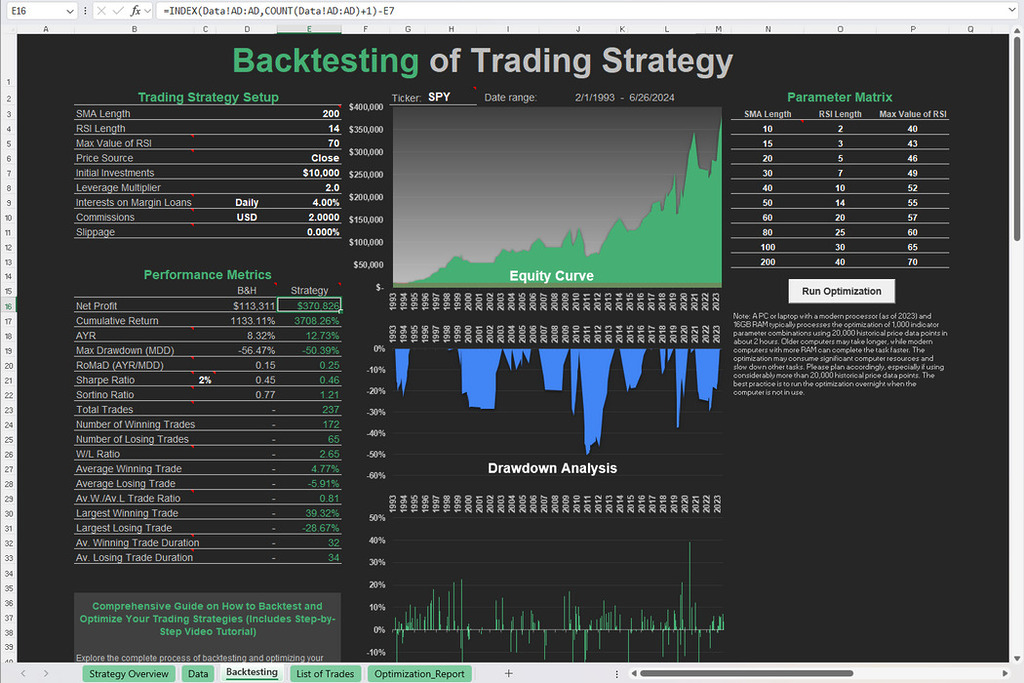
Free Backtesting Spreadsheet
Determining Position Size
The ATR indicator can also aid in determining position size. By factoring in the current ATR value, traders can adjust their position size to account for market volatility. In high-volatility environments, traders may reduce their position size to mitigate risk, while in low-volatility conditions, they can increase position sizes to capitalize on potential trends.
Volatility Breakout Trading
Volatility breakout trading is a popular strategy that utilizes the ATR indicator. Traders identify periods of low volatility by observing when the ATR value is relatively low. They then anticipate a breakout when the ATR starts to rise, indicating increasing volatility. Entry signals are triggered when the price breaks above or below a significant level, accompanied by a surge in the ATR value.
ATR Channels
ATR channels are constructed by plotting multiple lines based on ATR values around the price chart. These channels serve as dynamic support and resistance levels, with the width of the channels expanding or contracting based on changes in volatility. Traders can use ATR channels to identify potential trend reversals or breakout opportunities when the price penetrates the channel boundaries.
Trend Confirmation with ATR Indicator
The ATR indicator can serve as a tool for confirming trends. When the ATR is rising, it suggests increasing volatility, often accompanying strong trends. Conversely, declining ATR values may indicate weakening momentum or consolidation phases in the market. Traders can use this information to confirm the strength of a trend before entering or exiting positions.
ATR Trailing Stop
An advanced strategy involves using the ATR as a trailing stop. Instead of using a fixed price level for the stop loss, the stop level is adjusted based on changes in the ATR value. As the price moves in favor of the trade, the stop loss trails behind at a distance determined by a multiple of the ATR. This allows traders to stay in winning trades while protecting profits during adverse market conditions.
ATR Breakout Bands
ATR breakout bands are similar to Bollinger bands but use multiples of the ATR instead of standard deviations. These bands expand and contract based on changes in volatility, providing traders with a visual representation of market volatility. Breakouts above or below the bands signal potential trading opportunities, especially when accompanied by high volume or other confirming indicators.
Limitations of the ATR Indicator
While the ATR indicator offers valuable insights into market volatility, it is not without limitations. Like any technical tool, the ATR should be used in conjunction with other indicators and analytical methods to form a comprehensive trading strategy. Additionally, the ATR may not always accurately reflect future volatility, as it is based on historical price data. Sudden changes in market conditions or unforeseen events can lead to spikes in volatility that may not be captured by the ATR alone.
Backtesting with ATR Indicator Excel Template
Backtesting stands as a crucial phase in both developing and validating trading strategies, particularly those utilizing the ATR indicator. This process involves analyzing historical data and executing simulated trades according to predetermined rules. Through this method, traders can evaluate the effectiveness of their strategies, pinpointing potential strengths and weaknesses before implementing them in real-market scenarios. Keep reading to find out how to conduct backtesting using historical data and an Excel spreadsheet.
Gathering Historical Data
The first step in backtesting is obtaining high-quality historical data for the asset or market being traded. Many financial websites and data providers offer historical price data for various instruments, including stocks, forex pairs, and commodities. It’s essential to ensure that the data is accurate, reliable, and covers a sufficiently long-time horizon to capture diverse market conditions. You can start with Investing.com which provides free historical data in 1D time frame.
Setting Up the Excel Spreadsheet
Once the historical data is acquired, you can create a simple Excel spreadsheet to conduct your backtesting. The spreadsheet should include columns for date, open, high, low, close prices, as well as any additional indicators or variables used in the trading strategy. You can download Excel template for ATR indicator which was created for your convenience.
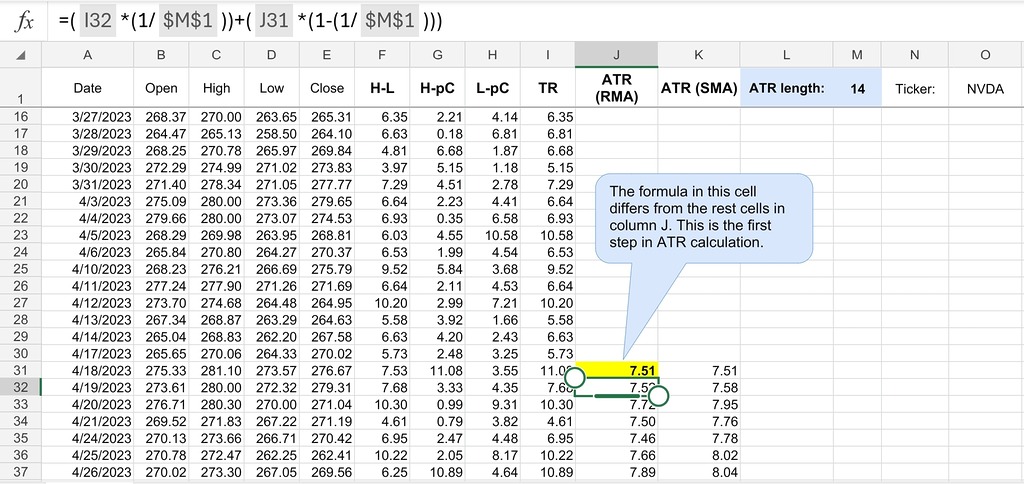
Data Input: Enter historical price data into the spreadsheet, including date, open, high, low, and close prices.
TR Calculation: Add 4 columns to calculate the TR. The first column is the absolute value of the difference between high and low. The second column – the absolute value of the difference between high and previous close. The third column – the absolute value of the difference between low and previous close. In the fourth column calculate TR.
ATR Calculation: Add column to calculate average true range. Utilize formula specified in the template to calculate the ATR based on the specified length.
Signal Generation: Part of the job is done in our template, so you just need to fit it to your strategy backtesting spreadsheet creating columns to generate buy and sell signals based on predefined rules.
Trade Execution: Implement columns to track trade executions, including entry and exit prices, position size, and profit/loss calculations.
Different Methods of ATR Calculation
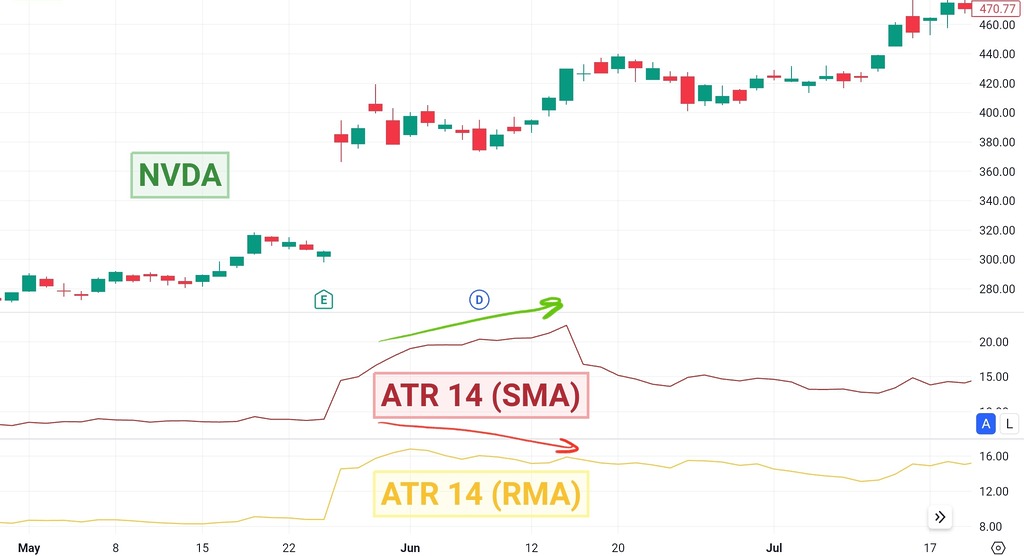
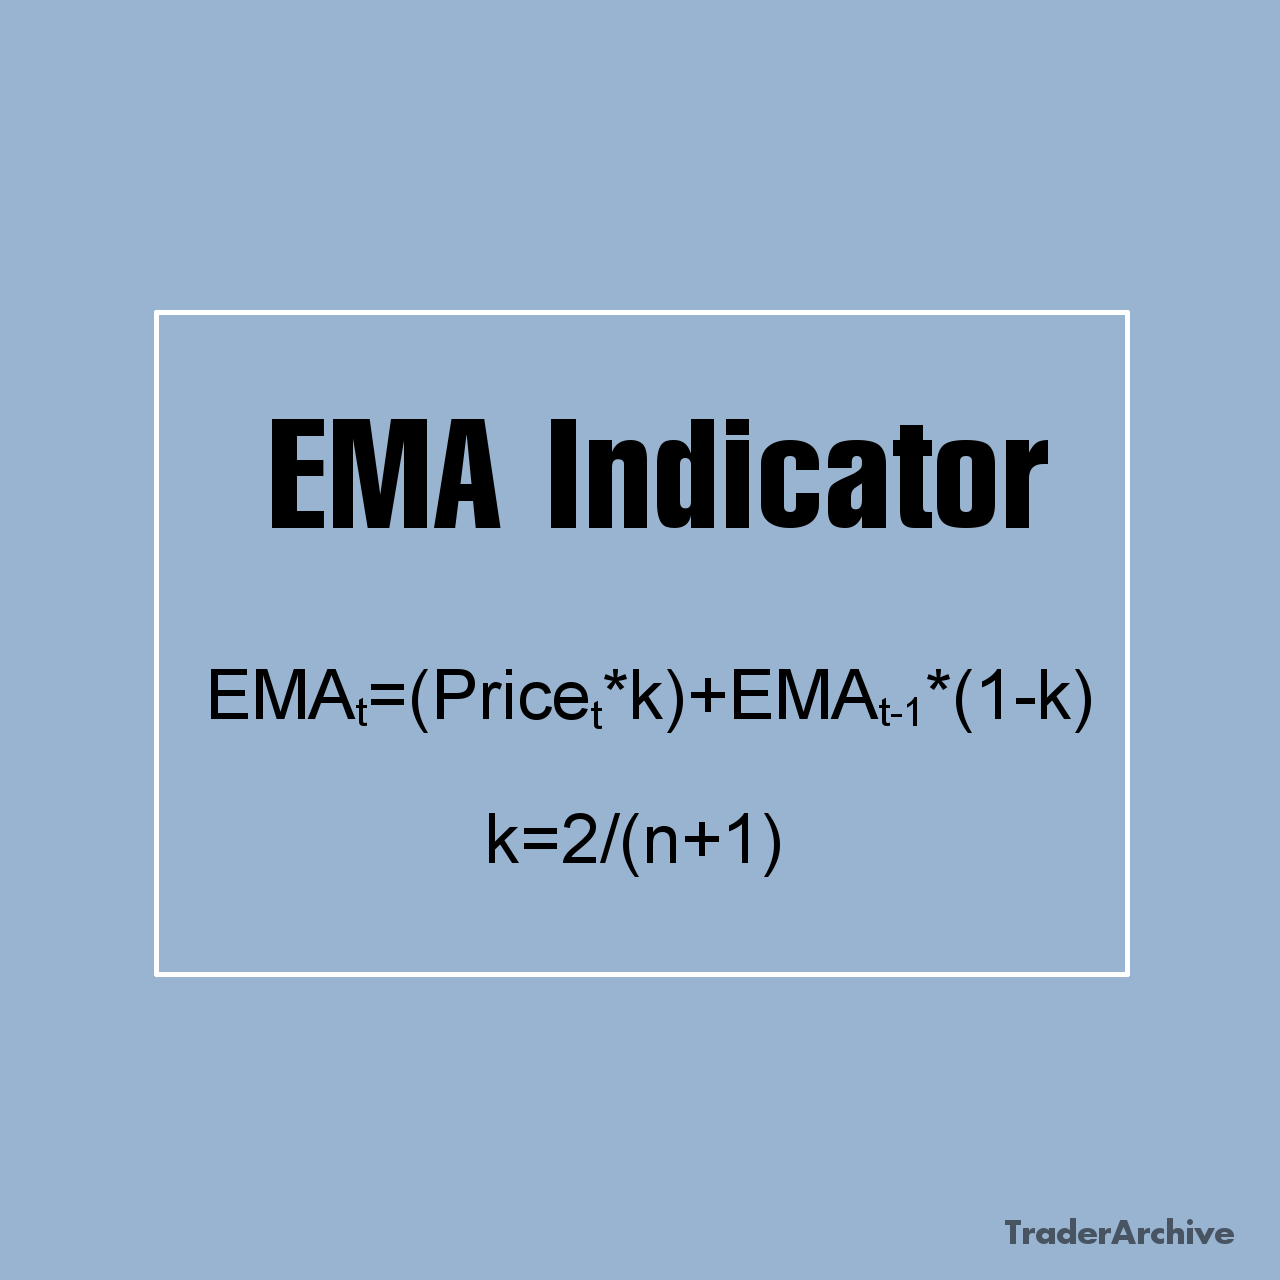
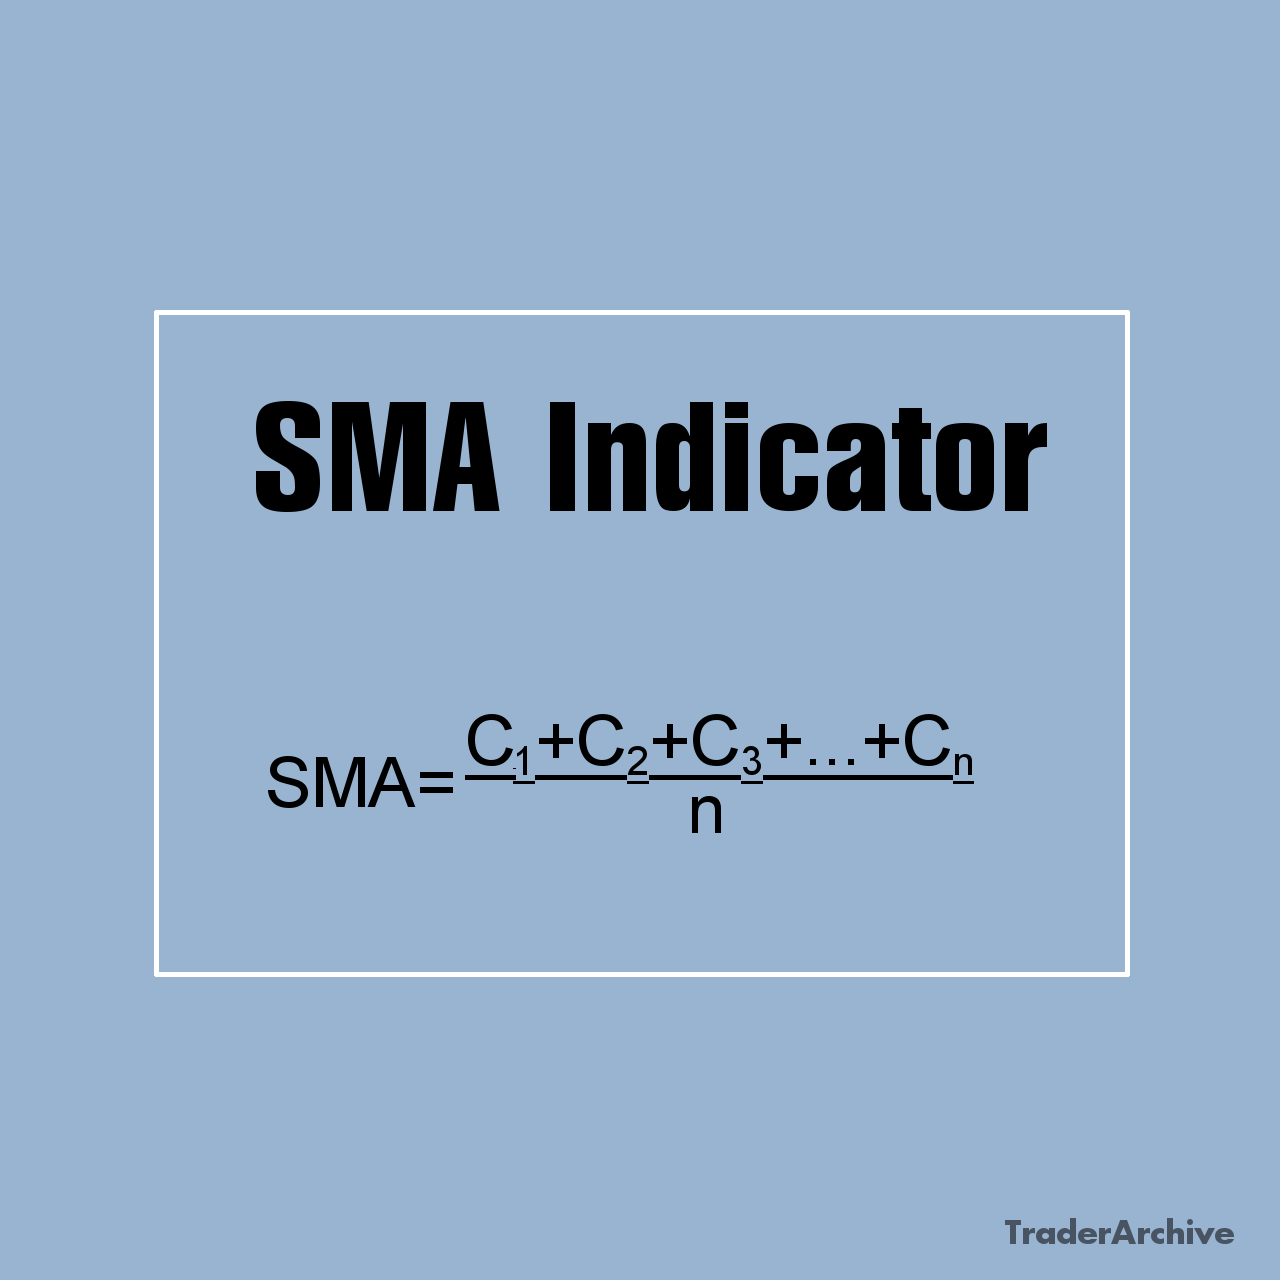
Within the provided template, you may have noticed that it includes the calculation of ATR using two different formulas. Many charting platforms (TradingView, Investing.com, Yahoo Finance etc.) utilize the same ATR formula as mentioned in this article. This formula entails the calculation of the relative moving average (RMA) of the true range. Nevertheless, certain charting platforms (MT4, WeBull) are programmed to utilize the simple moving average (SMA) of TR as the default method for ATR calculations. In certain instances, the variance between ATR values calculated by these two approaches can be substantial. Refer to the chart below to observe the distinction:
Final Thoughts
The ATR indicator is a powerful tool for assessing market volatility and guiding trading decisions. By quantifying price movements over a specified period, the ATR provides traders with valuable insights into the potential risks and opportunities in the market. Whether used for setting stop loss levels, identifying breakout opportunities, or adjusting position sizes, the ATR can enhance the effectiveness of trading strategies across various asset classes and timeframes. However, traders should exercise caution and supplement the ATR with other technical indicators and risk management techniques to build robust and adaptive trading systems. With a thorough understanding of its calculation, interpretation, and practical applications, traders can harness the full potential of the ATR indicator to navigate the complexities of financial markets successfully.
Share on Social Media:

Leave a Reply