In the dynamic world of financial markets, traders are constantly seeking tools and indicators to gain an edge. Among these tools, the Relative Strength Index (RSI) stands as a beacon of insight into market momentum and potential trends. Originally developed by J. Welles Wilder Jr. in the late 1970s, the RSI has become a cornerstone of technical analysis, offering traders a robust framework for evaluating the strength and direction of price movements. This article covers basics and features of the RSI indicator, exploring its calculation, interpretation, and practical applications in modern trading strategies.
What is RSI Indicator
The Relative Strength Index is a momentum oscillator that measures the speed and change of price movements. The RSI indicator oscillates between 0 and 100 and is typically plotted as a line graph beneath a price chart. The calculation of RSI involves comparing the magnitude of recent gains and losses over a specified period, commonly 14 days.
The RSI value provides traders with insights into whether an asset is overbought or oversold. A reading above 70 typically suggests overbought conditions, indicating a potential reversal or pullback in price. Conversely, an RSI below 30 suggests oversold conditions, signaling a possible bounce or reversal to the upside.
Applications of RSI in Charts
While the Relative Strength Index is widely known for its role in identifying overbought and oversold conditions, its utility extends beyond these simplistic thresholds. Savvy traders recognize various signals provided by RSI indicator that can enhance their trading strategies. Let’s delve deeper into the key applications of RSI beyond overbought and oversold conditions.
Overbought and Oversold Conditions
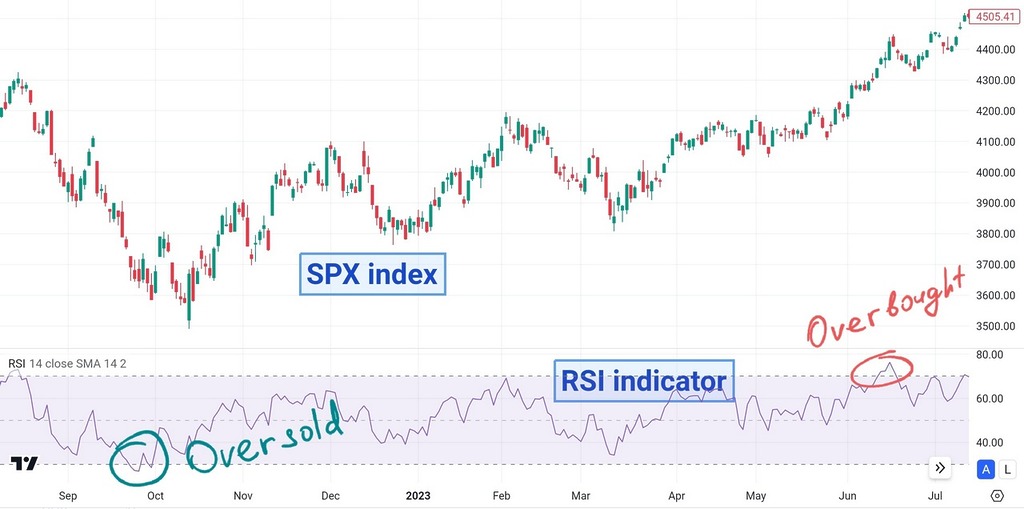
RSI readings above 70 indicate overbought conditions, while readings below 30 suggest oversold conditions. However, traders should exercise caution when solely relying on these thresholds. Strong trends can persist despite extreme RSI levels, and overbought or oversold conditions alone may not signal an imminent reversal.
Divergence
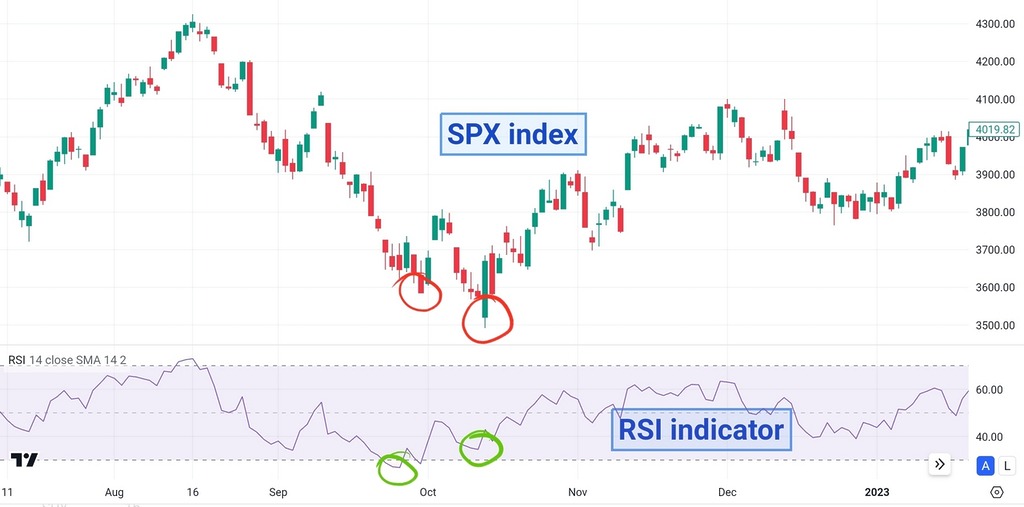
Divergence occurs when the price of an asset moves in the opposite direction of the RSI. Bullish divergence occurs when the price forms lower lows, but the RSI forms higher lows, suggesting potential bullish momentum. Conversely, bearish divergence occurs when the price makes higher highs, but the RSI forms lower highs, signaling potential bearish momentum. Divergence can provide valuable insights into potential trend reversals or continuations.
Failure Swings
A failure swing occurs when the RSI surpasses its previous high (or low) but fails to confirm the price action. For example, if the RSI peaks above 70 and then falls back below that level without confirming a new high in price, it could signal weakening bullish momentum and a potential reversal. Failure swings can act as early warning signs of impending trend changes.
Trend Confirmation
RSI can serve as a tool to confirm the strength of a prevailing trend. In an uptrend, RSI tends to remain above 50, indicating bullish momentum, while in a downtrend, RSI tends to stay below 50, signaling bearish momentum. Traders may look for opportunities to enter trades in the direction of the trend when RSI confirms the underlying momentum. Additionally, observing the slope and duration of RSI movements can provide further confirmation of trend strength or weakness.
Best Practices for Using RSI
While the Relative Strength Index is a powerful tool, its effectiveness relies on proper interpretation and integration into a robust trading strategy. Here are some known practices for maximizing the utility of RSI:
1. Combine with Other Indicators for Confirmation: RSI works best when used in conjunction with other technical indicators and analysis tools. Combining RSI with moving averages, trendlines, or volume analysis can provide additional confirmation signals and filter out false signals. For example, if RSI signals a potential trend reversal, confirming signals from other indicators can increase the confidence in the trade setup.
2. Adjust Period Settings to Suit Market Conditions: Experiment with different period settings to adapt to the timeframe and volatility of the asset being analyzed. Shorter periods (e.g., 9 or 10 days) are more sensitive to price movements and generate more frequent signals, making them suitable for shorter-term trading strategies. Conversely, longer periods (e.g., 20 or 30 days) provide smoother signals but may lag behind price action, making them more suitable for longer-term trend analysis.
Free Backtesting Spreadsheet
3. Confirm Signals with Price Action and Contextual Factors: Always corroborate RSI signals with price action and other contextual factors. While RSI signals can provide valuable insights, they should be validated by corresponding price patterns, support and resistance levels, or fundamental catalysts. For example, a bullish divergence signal on RSI is more potent when supported by a bullish reversal pattern on the price chart.
4. Exercise Patience and Discipline in Trade Execution: Avoid the temptation to chase every RSI signal and exercise patience and discipline in trade execution. Overtrading based solely on RSI signals can lead to poor performance, increased transaction costs, and emotional decision-making. Instead, wait for high-probability setups that align with your trading plan and risk management rules.
5. Adapt to Changing Market Conditions and Review Strategies Regularly: Market dynamics evolve over time, requiring traders to adapt their strategies accordingly. Periodically review and adjust RSI parameters, such as period settings and overbought/oversold thresholds, to accommodate shifting market conditions and avoid stagnation. Flexibility and adaptability are key traits of successful traders.
RSI Formula
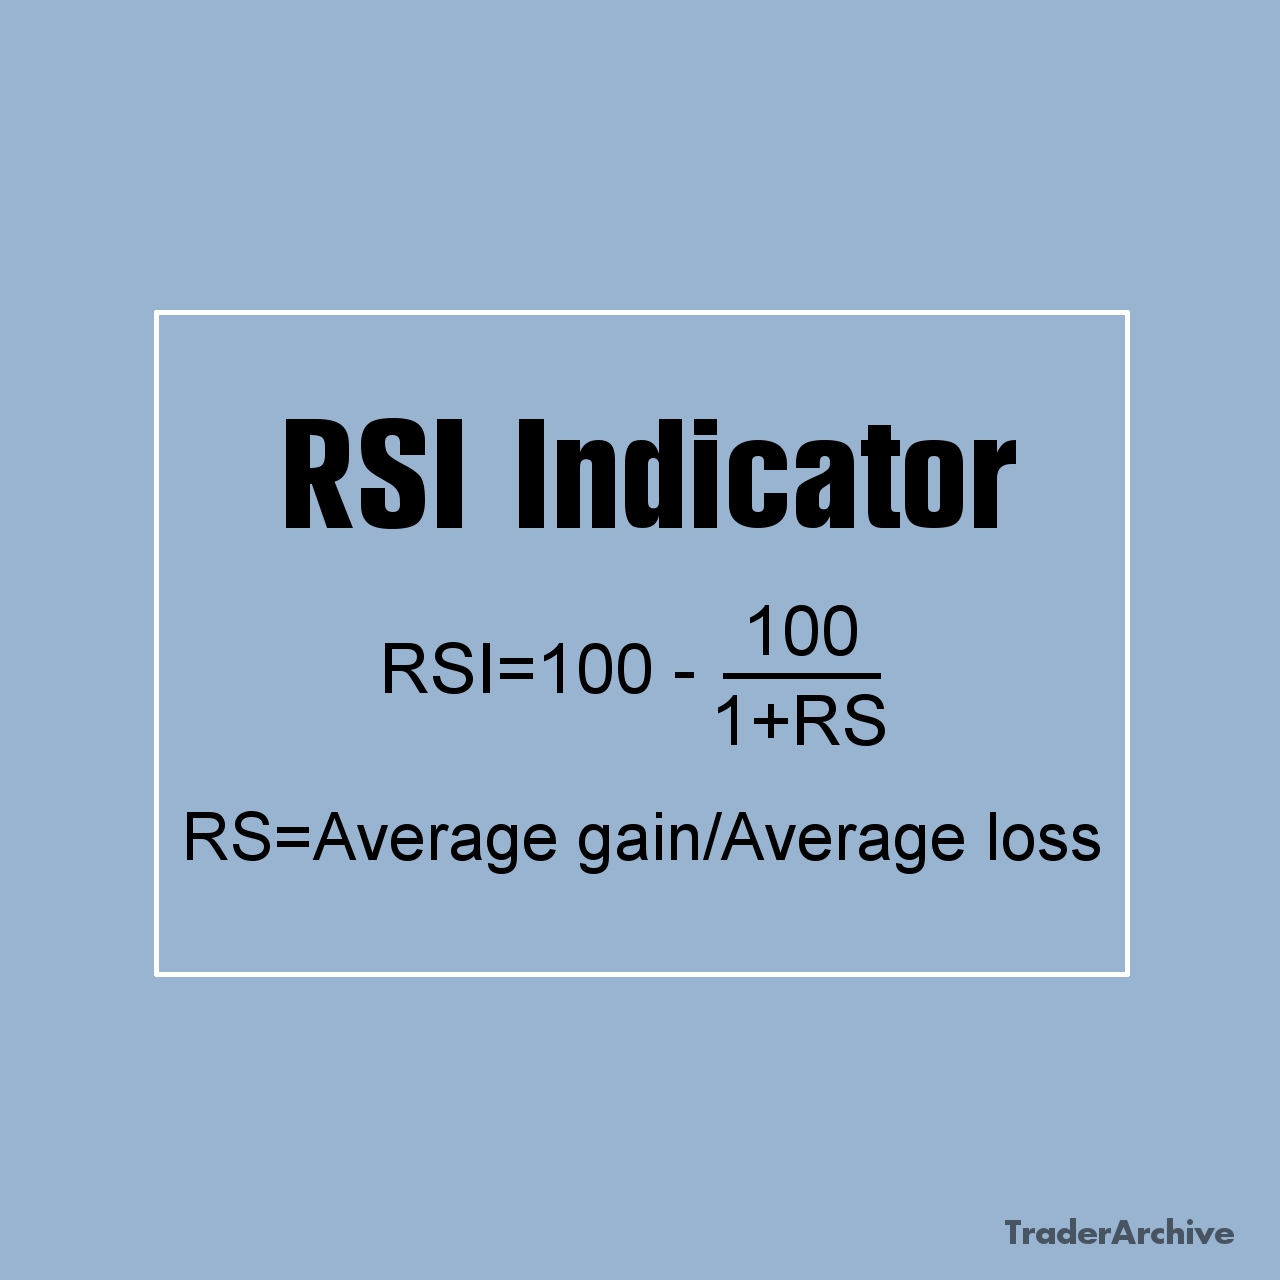
The formula for RSI is as follows:

Where:
RS (Relative Strength) = Average of n days’ gains / Average of n days’ loses
Important Notice About RSI Formula
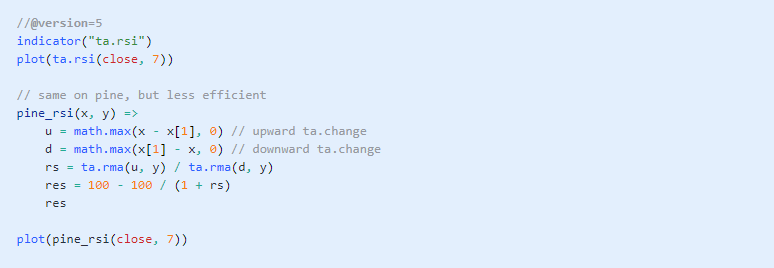
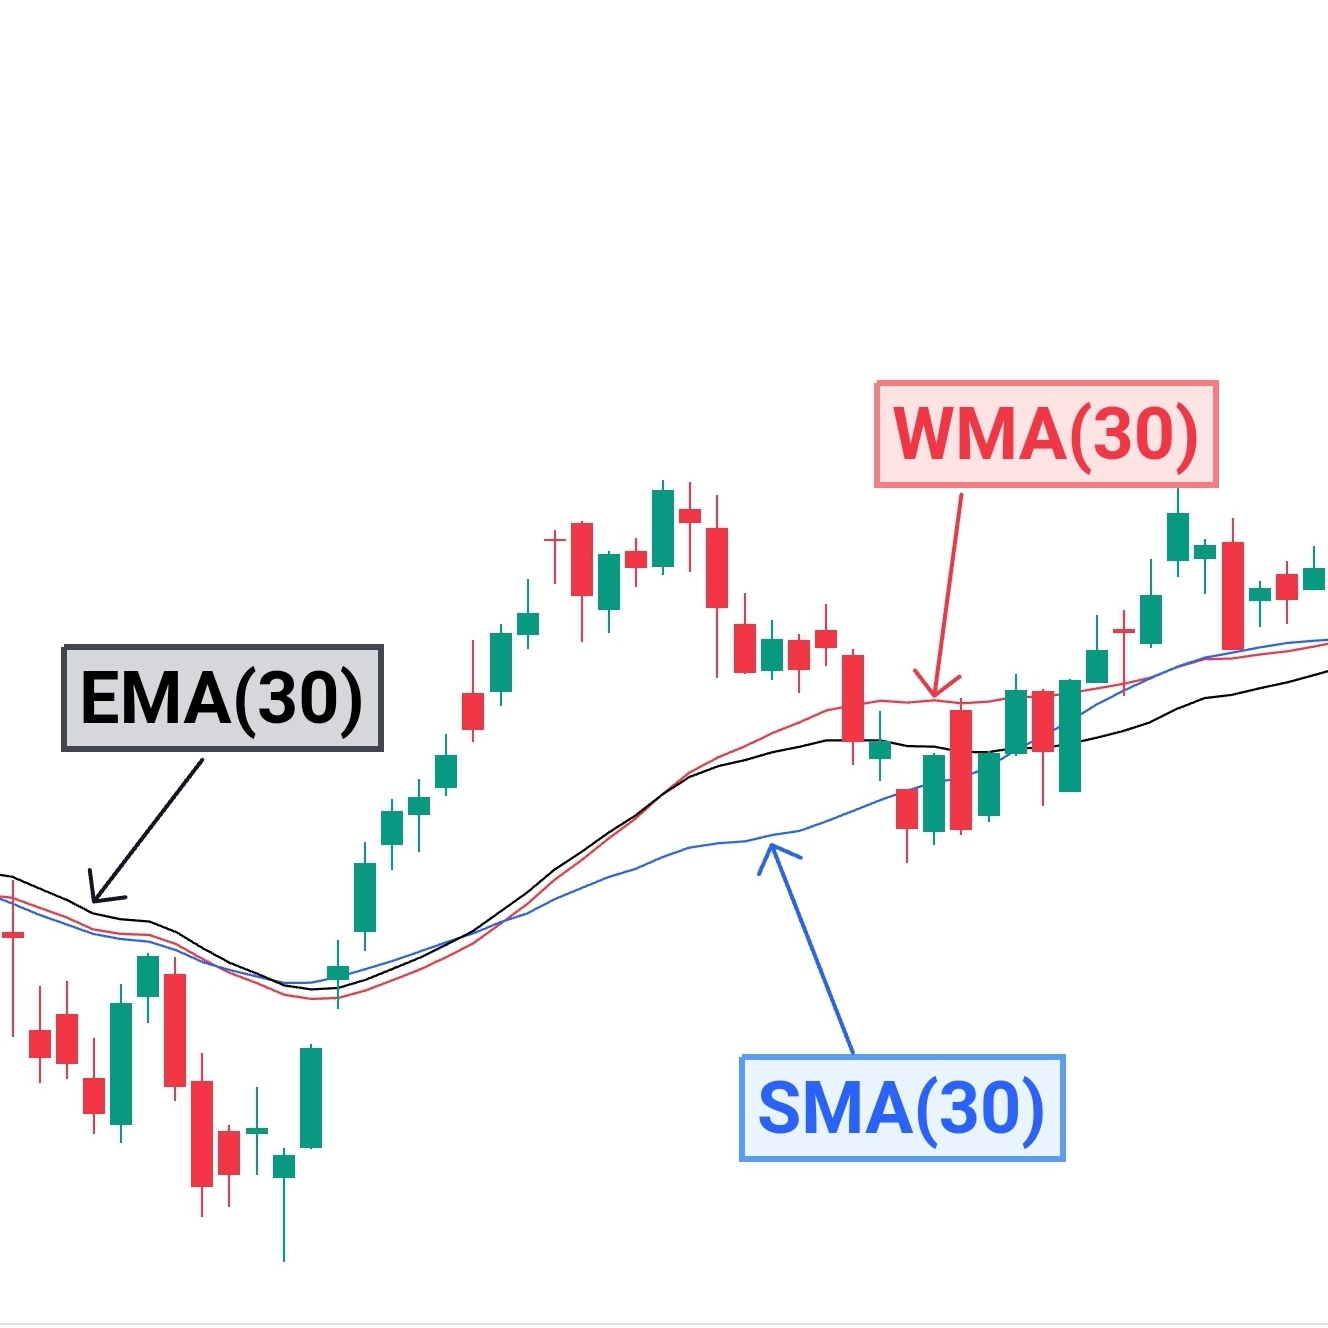
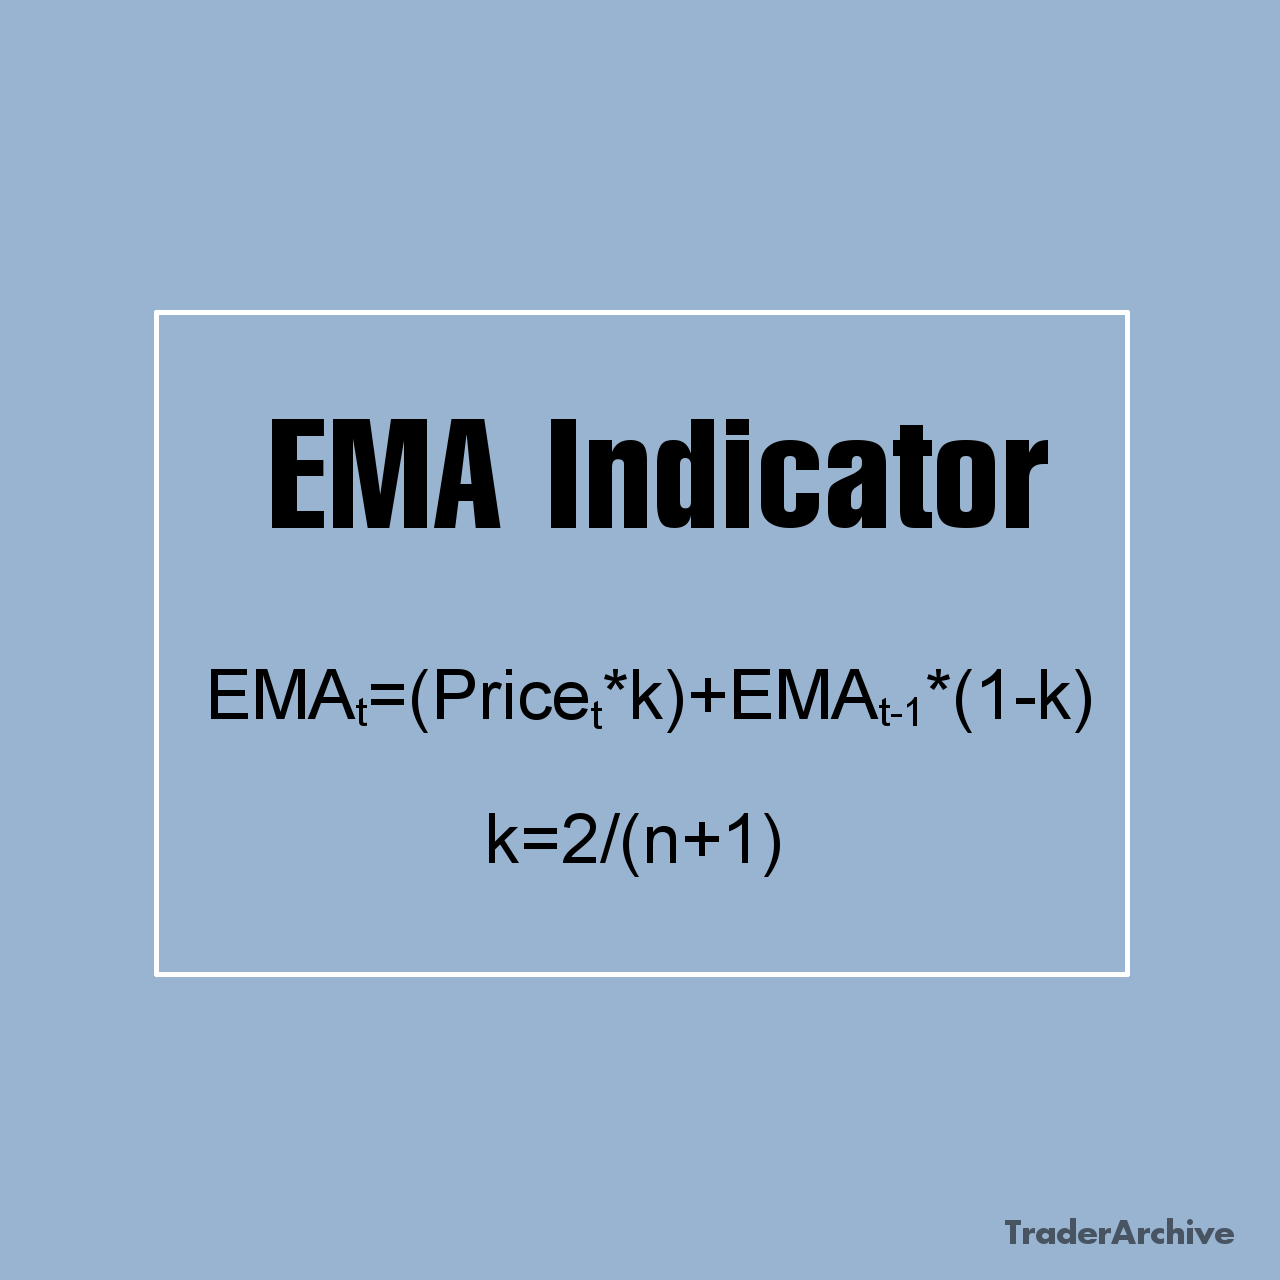
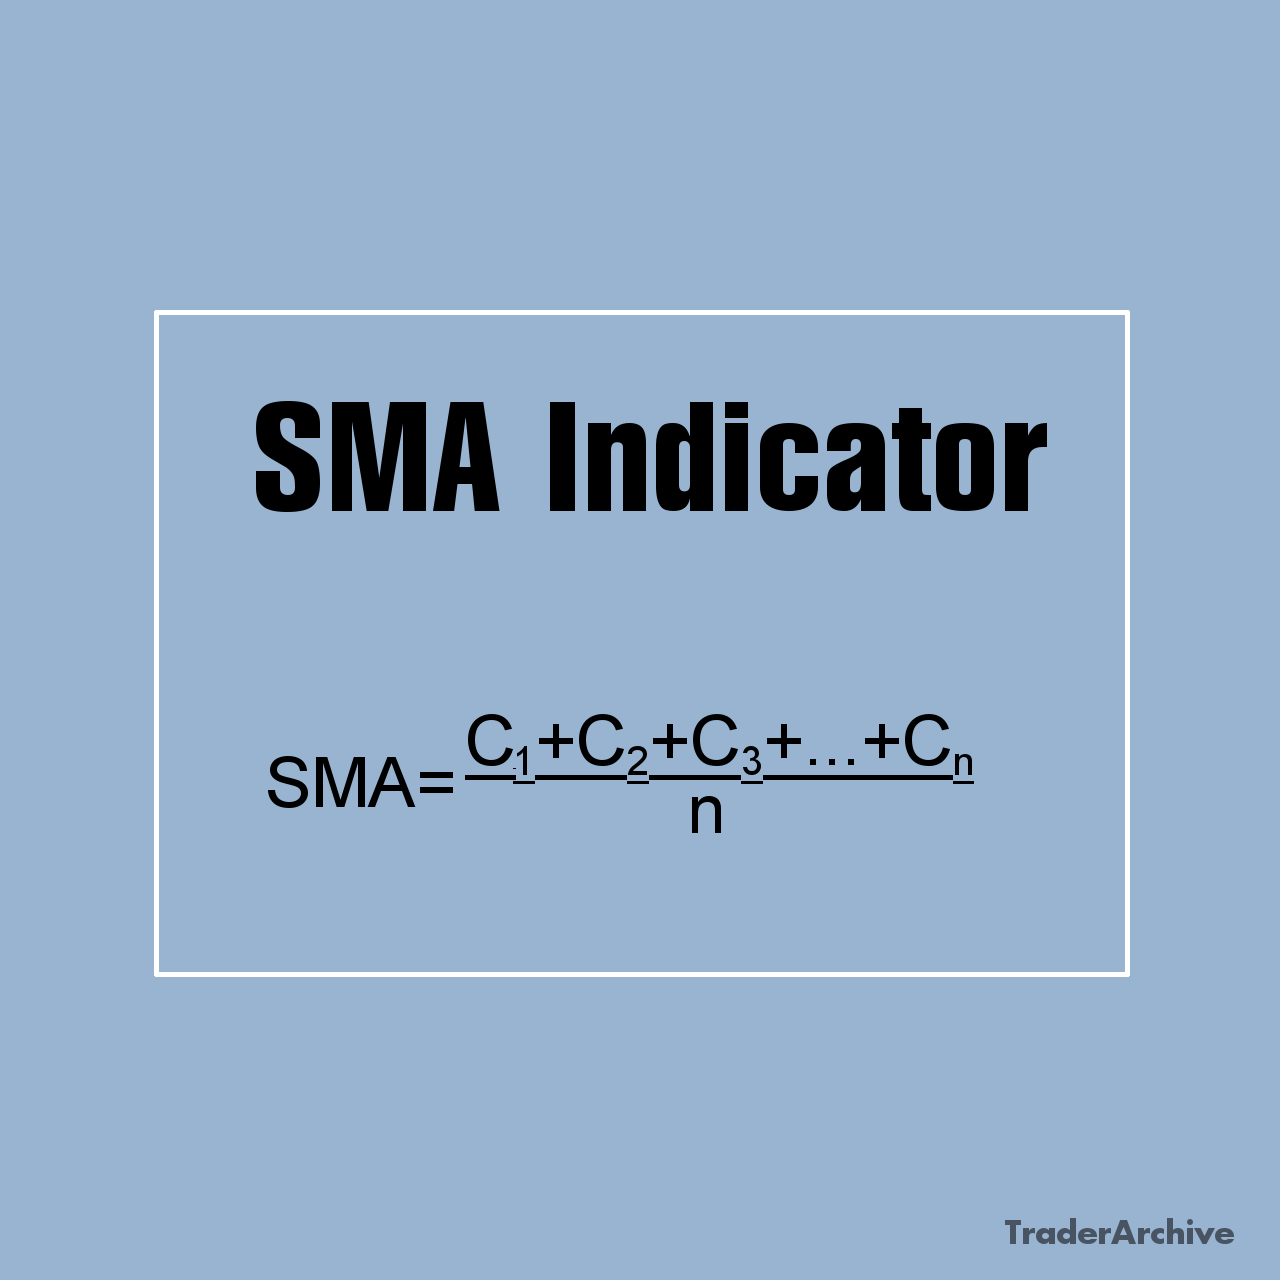
When exploring the Relative Strength Index formula across various resources, you may encounter references to an “Average” without specifying the exact type used. While this detail might seem inconsequential to discretionary traders, it can significantly impact algorithmic trading strategies. For instance, imagine backtesting a strategy with RSI indicator using a Simple Moving Average (SMA) for RS calculation. If triggers are applied in live trading with RSI using a different average, such as Relative Moving Average (RMA), a type of EMA, this discrepancy could lead to disparate outcomes.
For example, TradingView and MetaTrader employ different averages in their RSI indicator formulas. While many online sources describe the RSI formula with SMA for RS calculation, a closer examination of Pine Script documentation reveals that TradingView’s ta.rsi function uses RMA for RS calculation:
In the subsequent section of this article, we’ll explore how to calculate RSI in Excel using both types of formulas and illustrate the differences in outcomes.
How to Compute RSI with Excel Template for Backtesting
Backtesting is a crucial step in evaluating the effectiveness of trading strategies before deploying them in live markets. By simulating trades using historical data, you can assess the performance of your strategies, identify potential flaws, and make necessary adjustments to improve profitability. Let`s explore how you can conduct backtesting using Excel spreadsheets, leveraging historical price data and the RSI indicator.
Setting Up Historical Data in Excel
The first step in backtesting is acquiring historical price data for the asset or market you want to analyze. There are several sources for historical data, including financial websites, data providers, and trading platforms. You can start with Investing.com which provides free historical data in 1D time frame. Once you’ve obtained the data, import it into Excel, organizing it into columns with date, open, high, low, close prices, and any other relevant variables.
Calculating RSI in Excel
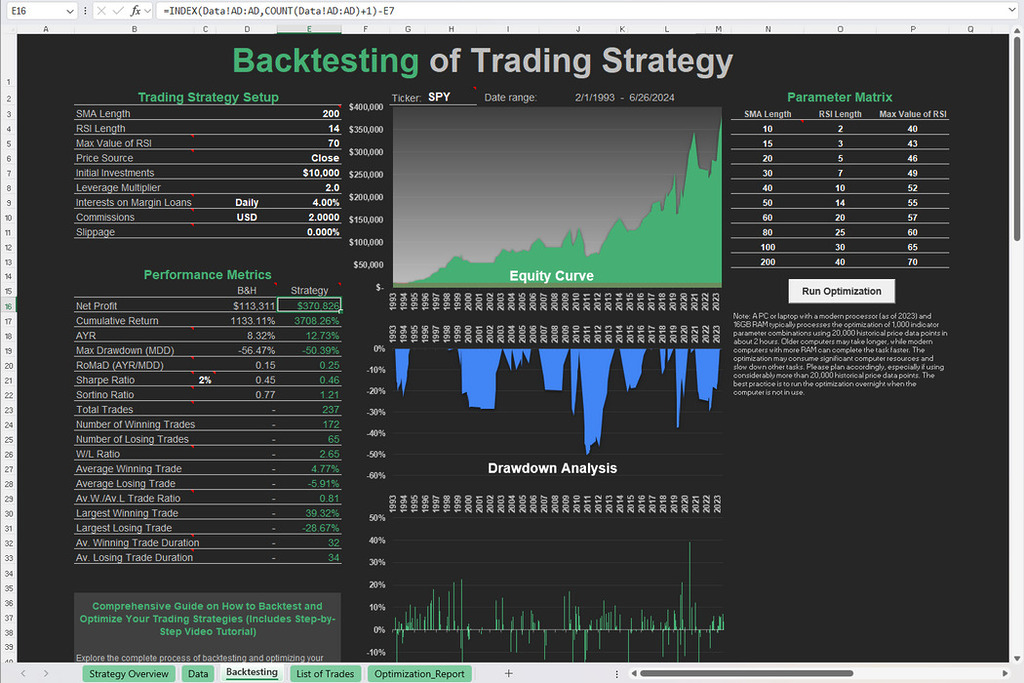
With historical price data in hand, the next step is to calculate the RSI for the specified period. Utilizing Excel’s built-in functions, you can compute the RSI values for each data point. You can download Excel template for RSI indicator which was created for your convenience.
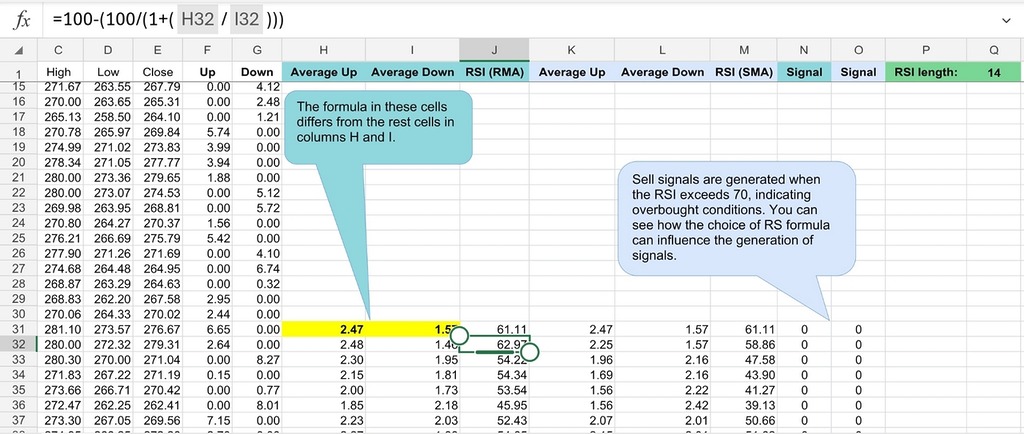
Data Input: Enter historical price data into the spreadsheet, including date, open, high, low, and close prices.
Calculate Price Changes: Add columns to calculate the price changes for each day by subtracting the previous day’s closing price from the current day’s closing price.
Calculate Average Gains and Losses: Add columns to compute the average gains and losses over the specified period (14 days in this template).
Calculate RSI: Add columns to calculate RSI using the formula mentioned earlier.
Signal Generation: Create columns to generate buy and sell signals based on predefined rules. In the template, a sell signal occurs when RSI exceeds 70 (overbought). Part of the job is done in our template, so you just need to fit it to your strategy backtesting spreadsheet.
Trade Execution: Implement columns to track trade executions, including entry and exit prices, position size, and profit/loss calculations.
Designing and Implementing Trading Strategies
After calculating RSI values, you can design trading strategies based on RSI signals, such as overbought and oversold conditions, divergences, and trend confirmations. For example, a simple strategy could be:
- Buy Signal: When RSI crosses below 30, indicating oversold conditions.
- Sell Signal: When RSI crosses above 70, indicating overbought conditions.
Implement these signals in Excel by creating columns to track buy and sell decisions based on RSI thresholds. Include additional columns to calculate profits or losses for each trade.
Analyzing Results and Making Adjustments
Once backtesting is complete, analyze the results to evaluate the performance of the trading strategy. Calculate key performance metrics such as win rate, average profit/loss per trade, maximum drawdown, and overall return on investment (ROI). Identify strengths and weaknesses of the strategy and consider making adjustments to improve its performance.
Advanced RSI Techniques
While the RSI is a powerful tool on its own, advanced traders may seek to refine and optimize RSI indicator signals further using advanced techniques. These techniques go beyond the basic interpretation of RSI and offer sophisticated methods for enhancing the accuracy and reliability of RSI signals in various market conditions.
Smoothing Techniques
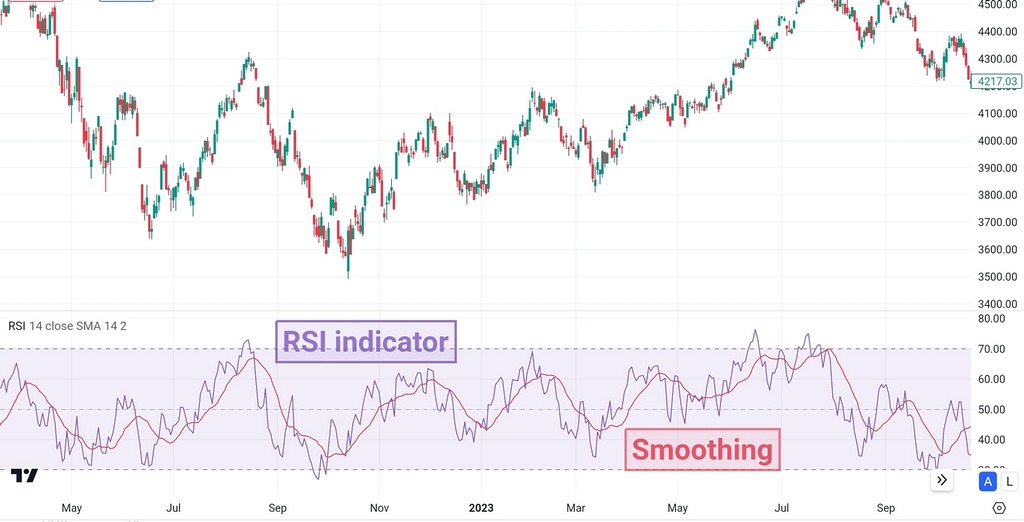
Smoothing techniques involve applying mathematical calculations to RSI values to reduce noise and provide clearer signals. Common smoothing methods include applying moving averages or exponential smoothing to RSI values. By smoothing RSI signals, traders can filter out short-term fluctuations and focus on the underlying trend, leading to more reliable trade setups.
Stochastic RSI
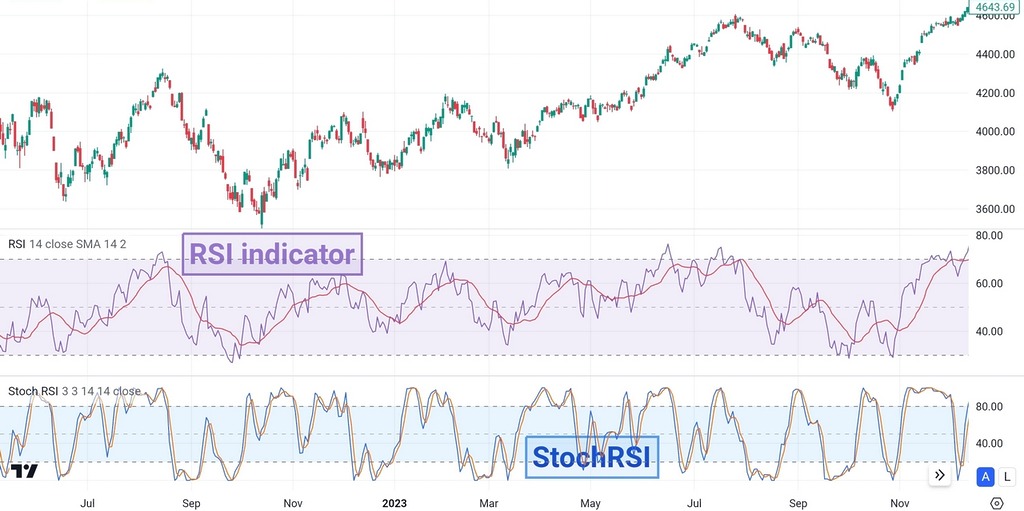
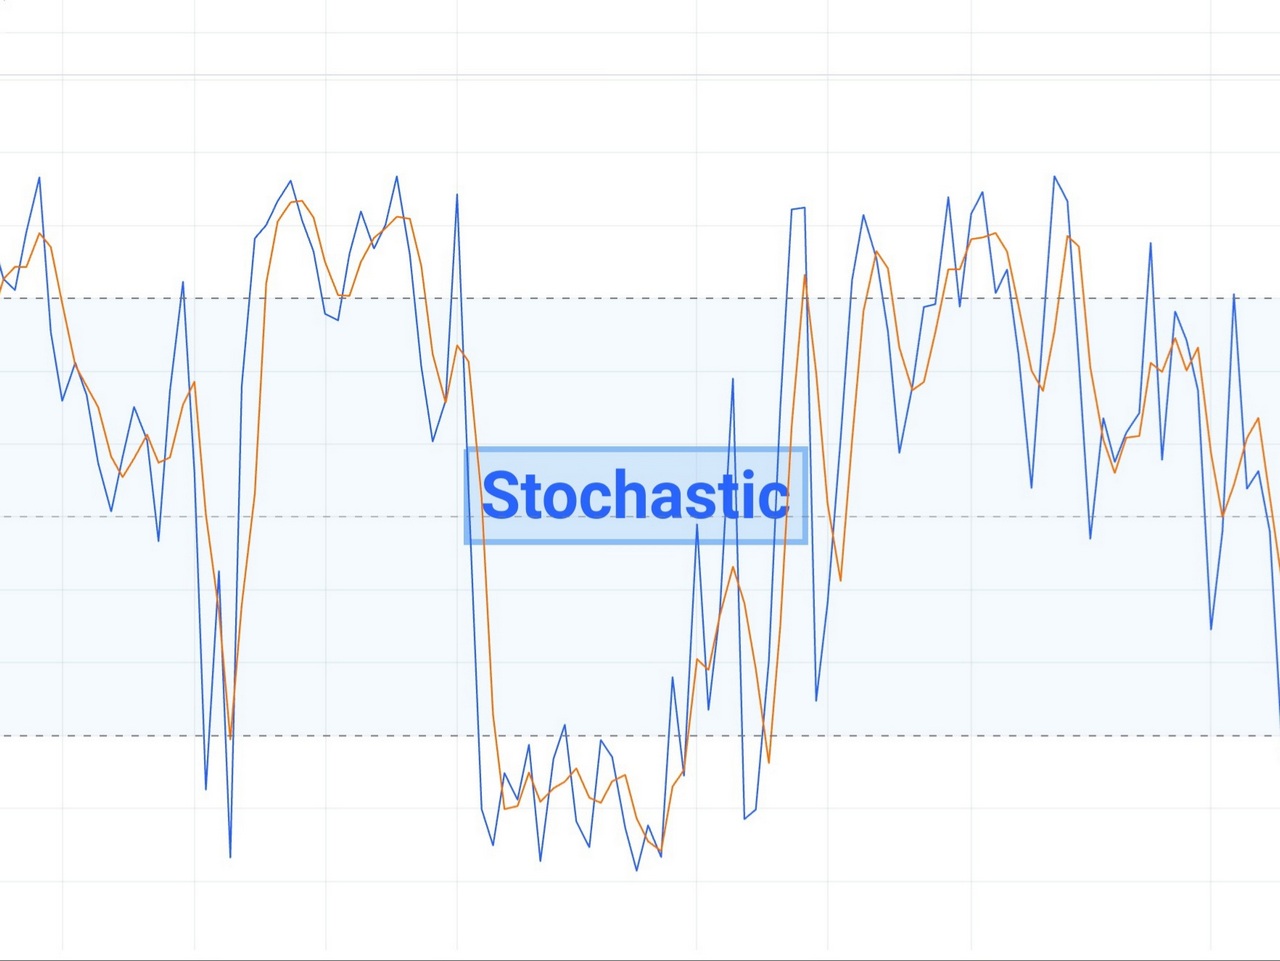
Stochastic RSI indicator combines elements of both the RSI and the Stochastic Oscillator to provide a more refined measure of momentum and overbought/oversold conditions. Instead of using fixed thresholds like traditional RSI, stochastic RSI calculates the position of the RSI within its recent range, offering insights into the relative strength of recent price movements. Stochastic RSI can help traders identify potential trend reversals or continuations with greater precision.
Volatility-Adjusted RSI
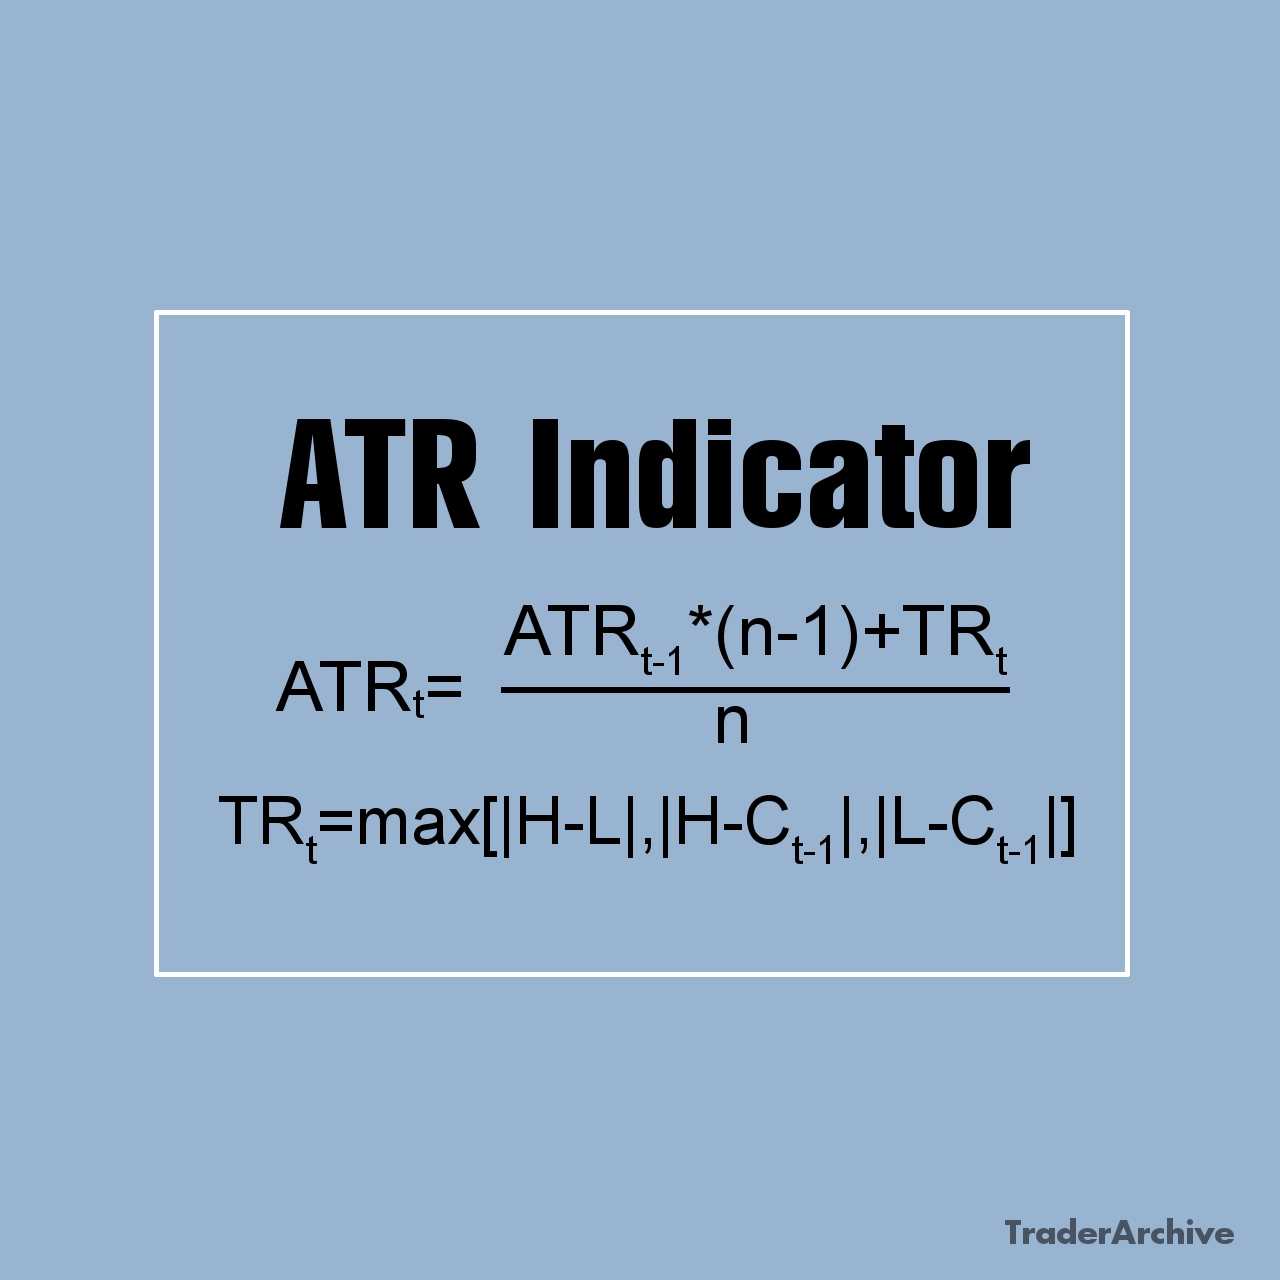
Volatility-adjusted RSI indicator aims to normalize RSI readings based on the level of market volatility. High volatility environments may result in exaggerated RSI readings, leading to false signals. By incorporating measures of volatility, such as average true range (ATR), into RSI calculations, traders can adjust RSI signals to account for changing market conditions. Volatility-adjusted RSI helps traders identify genuine overbought and oversold conditions amidst fluctuating volatility levels.
Cycle Analysis with RSI
Cycle analysis involves studying repetitive patterns or cycles in price movements and combining them with RSI signals to anticipate future price behavior. Advanced traders may use techniques such as spectral analysis or Fourier transforms to identify dominant cycles in the market and align RSI signals with these cycles. By incorporating cycle analysis into RSI-based strategies, traders can gain a deeper understanding of market rhythms and improve their timing of trade entries and exits.
By exploring these advanced RSI techniques, experienced traders can elevate their trading strategies to a higher level of sophistication. However, it’s essential to thoroughly backtest and validate these techniques before implementing them in live trading, as they may require a deeper understanding of market dynamics and greater proficiency in technical analysis.
Final Thoughts
The Relative Strength Index remains a versatile and indispensable tool for traders across various financial markets. Whether used to identify trends, spot potential reversals, or confirm the strength of price movements, RSI indicator offers valuable insights into market dynamics. However, it’s essential for traders to understand that RSI is not a standalone indicator but rather a piece of the larger puzzle in technical analysis. By combining RSI with other indicators and employing sound risk management principles, traders can harness the full potential of this powerful oscillator to achieve their trading objectives.
Share on Social Media:
FAQ
What is RSI indicator, and how does it work?
RSI is a popular technical indicator used by traders to measure the momentum of price movements in financial markets. It oscillates between 0 and 100 and is calculated based on the average gains and losses over a specified period, typically 14 days. RSI values above 70 indicate overbought conditions, while values below 30 suggest oversold conditions.
How can RSI indicator help me in trading?
RSI indicator can help you identify potential trend reversals, overbought and oversold conditions, and the strength of prevailing trends. By interpreting RSI signals, you can make informed decisions about when to enter or exit trades, as well as when to adjust their trading strategies.
What are some common mistakes to avoid when using RSI?
One common mistake is relying solely on RSI thresholds (70 for overbought and 30 for oversold) without considering other factors. It’s essential to understand that markets can remain overbought or oversold for extended periods, and RSI signals should be used in conjunction with other indicators and analysis techniques for confirmation.
Can RSI be used for different timeframes and markets?
RSI can be applied to various timeframes, from intraday to weekly charts, depending on the trader’s preferences and trading style. Additionally, RSI can be used across different markets, including stocks, forex, commodities, and cryptocurrencies, making it a versatile tool for traders across various asset classes.
Are there any limitations to using RSI in trading?
RSI indicator may not perform well in strongly trending markets, as it can remain in overbought or oversold territory for extended periods.

Leave a Reply