
A yield curve is a graphical representation of the yields or interest rates of bonds or securities of similar credit quality but different maturities, plotted on a graph. It provides valuable insights into the relationship between the term or maturity of a bond and its yield or interest rate. Yield curves are widely used by investors, economists, and policymakers to analyze and forecast economic conditions, monetary policy, and market expectations.
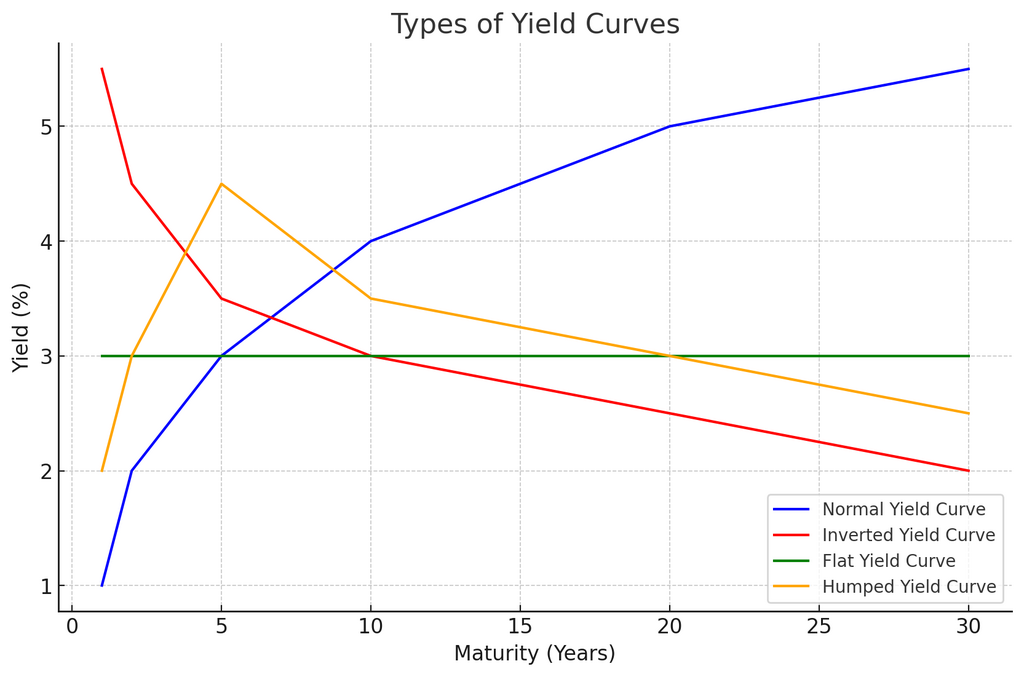
Types of Yield Curves
Normal Yield Curve
A normal yield curve is characterized by an upward slope, indicating that long-term interest rates are higher than short-term rates. This shape typically reflects expectations of economic expansion, as investors demand higher compensation for locking in their funds for longer periods due to anticipated future growth and inflation.
Inverted Yield Curve
An inverted yield curve occurs when short-term interest rates are higher than long-term rates, resulting in a downward slope. This phenomenon is often interpreted as a signal of impending economic recession, as investors anticipate lower future inflation and economic slowdown, driving down long-term yields.
Flat Yield Curve
A flat yield curve indicates little or no difference between short-term and long-term interest rates, resulting in a horizontal line on the graph. This shape may suggest uncertainty or indecision in the market regarding future economic conditions, monetary policy, or inflation expectations.
Humped Yield Curve
A humped yield curve features a rise in yields for intermediate maturities, creating a hump-shaped curve. This pattern may reflect temporary market conditions, such as uncertainty about future interest rates or economic performance. It can also occur during periods of monetary policy tightening or easing.
Maturity: Maturity refers to the time remaining until a bond or security reaches its maturity date, at which point the principal is repaid to the bondholder. Bonds with longer maturities typically offer higher yields to compensate investors for the increased risk and uncertainty associated with holding the bond for a longer period.
Yield or Interest Rate: Yield or interest rate represents the return that investors receive for holding a bond or security. It is expressed as a percentage of the bond’s face value and may include coupon payments and potential capital gains or losses upon maturity. Yields are influenced by various factors such as inflation expectations, monetary policy, economic growth, and market demand.
Factors Influencing Yield Curves
- Monetary Policy: Central banks play a crucial role in shaping yield curves through their monetary policy decisions, including adjustments to short-term interest rates and bond-buying programs. Changes in monetary policy stance, such as tightening or easing, can impact short-term rates and influence the shape of the yield curve.
- Inflation Expectations: Expectations about future inflation rates significantly influence long-term bond yields. Higher inflation expectations typically lead to higher long-term yields to compensate investors for the eroding purchasing power of future cash flows. Conversely, lower inflation expectations may result in lower long-term yields.
- Economic Outlook: Market participants closely monitor economic indicators and forecasts to assess the trajectory of economic growth, employment, and inflation. Positive economic data indicating robust growth prospects may steepen the yield curve, while negative data suggesting economic weakness could flatten or invert the curve.
- Supply and Demand Dynamics: Supply and demand dynamics in the bond market can also impact yield curves. Increased demand for long-term bonds relative to short-term bonds may drive down long-term yields, leading to a flatter or inverted curve. Correspondingly, higher demand for short-term bonds may drive down short-term yields, steepening the curve.
- Global Factors: Yield curves can be influenced by global economic trends, geopolitical events, and international capital flows. Changes in global interest rates, trade tensions, or financial market volatility may spill over into domestic bond markets, affecting yield curve dynamics.

Free Backtesting Spreadsheet
Applications of Yield Curves
Yield Curve as an Economic Indicator
Yield curves are considered leading indicators of economic activity and inflation. Changes in the shape of the yield curve can signal shifts in market expectations, monetary policy outlook, and the overall health of the economy. Policymakers use yield curve analysis to assess the effectiveness of monetary policy tools and to gauge the potential impact on economic growth and inflation.
Application in Investment Strategies
Investors use yield curve analysis to formulate investment strategies and assess risk-return trade-offs. For example, a steepening yield curve may prompt investors to allocate more funds to longer-term bonds to capture higher yields, while an inverted curve may signal the need to adjust portfolios to mitigate recessionary risks.
Fixed-Income Markets
Yield curves serve as a benchmark for pricing fixed-income securities, such as bonds, mortgages, and corporate debt. Bond traders and investors compare the current shape of the yield curve with historical patterns to identify opportunities for arbitrage or relative value trades.
Corporate Finance
Businesses and corporations use yield curve data to make financing decisions, such as issuing bonds or securing loans. The shape of the yield curve affects borrowing costs and funding strategies, influencing corporate investment and capital allocation decisions.
Risk Management
Financial institutions and risk managers utilize yield curve analysis to assess interest rate risk exposure and to implement hedging strategies. Changes in the yield curve shape can impact the valuation of fixed-income portfolios and derivative instruments, requiring proactive risk management measures.
Tracking Changes of Yield Curve
One common method for representing historical changes in the yield curve is by calculating the difference, or slope, between the interest rates of long-term and short-term bonds. This can be achieved through a time series plot or chart. In a normal yield curve, the slope is positive, as long-term interest rates are higher than those for short-term bonds. Conversely, an inverted yield curve has a negative slope, while a flat yield curve exhibits a slope close to zero.
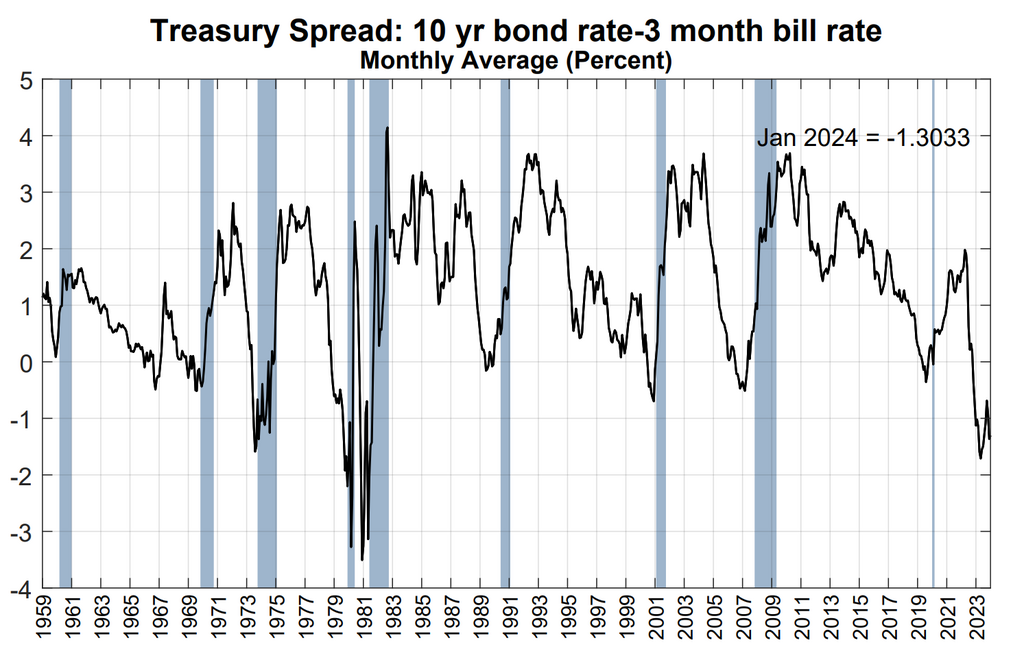
Difference between the interest rates of long-term and short-term bonds. Recessions (grey). Source: Federal Reserve Bank of New York
This analytical approach is widely used in the fields of finance and economics to assess interest rate dynamics and market expectations.
Final Thoughts
In summary, yield curves provide valuable insights into the relationship between bond yields and maturities, reflecting market expectations, economic conditions, and monetary policy dynamics. By analyzing the shape and movement of yield curves, investors, economists, and policymakers can gain valuable insights into future interest rate trends, inflation expectations, and economic prospects. Understanding the intricacies of yield curve analysis is essential for making informed investment decisions, managing risk, and navigating the complexities of global financial markets.
Share on Social Media:


