Backtest Strategy with Prebuilt Spreadsheets
Effortlessly backtest and optimize trading strategies with our Excel-based tools. Perfect for traders of all levels.

Automated Optimization
Run optimization of thousands of technical indicator parameter combinations with a single click.

User-Friendly
No need for programming skills. Just basic knowledge of Excel, such as copying and pasting data.

Comprehensive Analysis
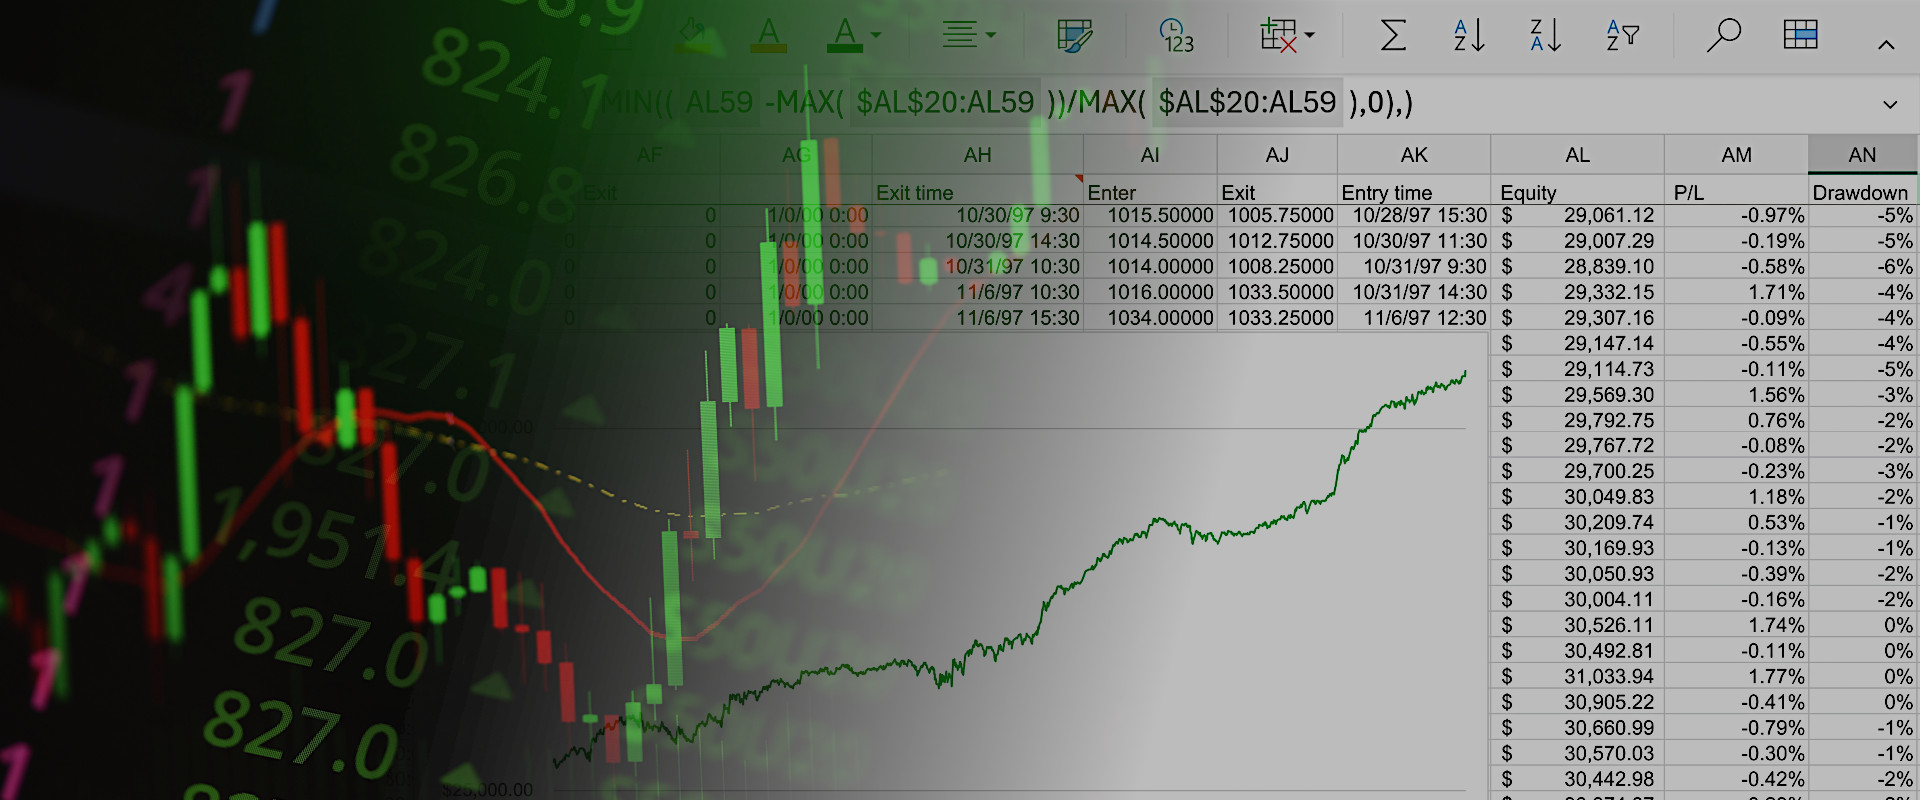
Get detailed performance metrics and charts to make informed trading decisions.
Why Choose Our Spreadsheets?
Our backtesting spreadsheets are fully transparent and editable, empowering you to customize every aspect to suit your trading strategies and optimize with precision.
1000+
Indicator Parameter Combinations
40+
Strategies
18
Performance Metrics


Explore the Power of Our Backtesting Spreadsheets
Collection of Trading Strategies
Each backtesting spreadsheet represents a specific trading strategy, meticulously crafted to reflect various market conditions. Our packs of spreadsheets cover a wide range of strategies, serving as valuable prompts for you to explore, test, and find the best fit for your trading style.
Discovering the Best Indicator Parameters
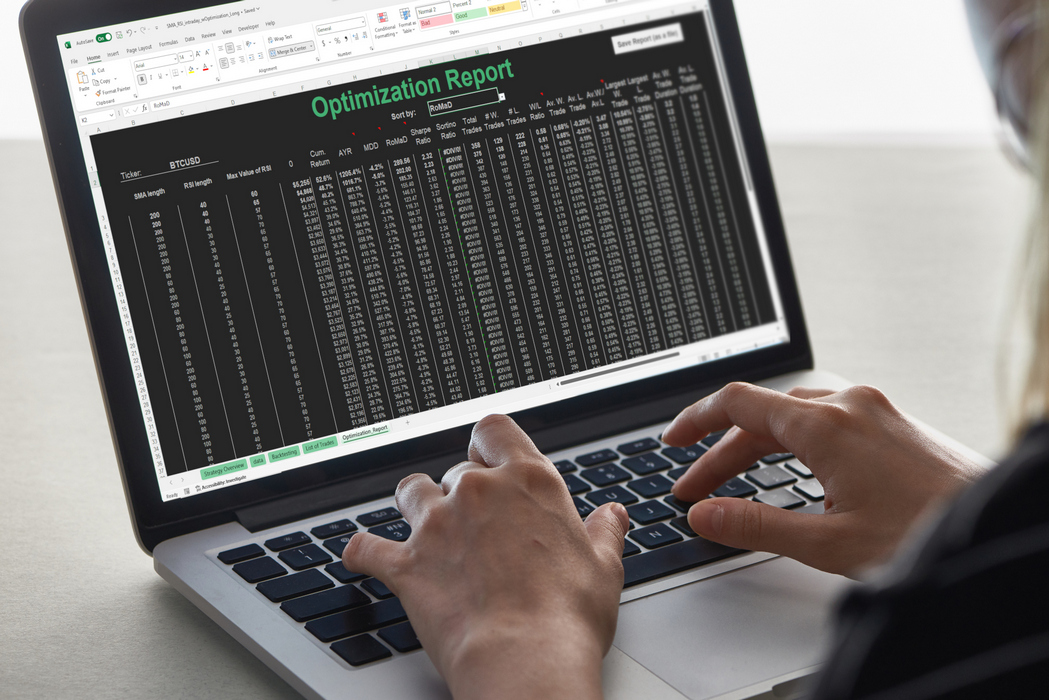
Each strategy is a combination of indicators with specific parameters (such as the length of an EMA or the value of an RSI). Finding the optimized combination is crucial for maximizing performance. Our automated optimization process evaluates thousands of indicator parameter combinations, ensuring that you have the most effective configuration for your strategy.
Detailed Performance Metrics
Our spreadsheets include widely used performance metrics such as Average Return, Maximum Drawdown, Sharpe Ratio, Sortino Ratio, W/L Ratio and more. These metrics provide a comprehensive view of the strategy’s performance, helping you make informed trading decisions.
See How It Works
Watch a quick guide on how to use our backtesting spreadsheets for optimizing your trading strategies.
SPECIAL OFFER
Discount for all backtesting packs.

Choose Your Backtesting Pack
Explore our comprehensive range of backtesting strategy packs (one-time purchase). Whether you’re focused on intraday or long-term trading, we have the perfect pack for you.
Start with a free sample and see how it works.
FREE
Sample
1 Spreadsheet
1D Time frame
18 Performance Metrics
Non-Editable
Manual Optimization
EMA Crossover Essentials
$11.00
2 Spreadsheets
1D Time Frame
18 Performance Metrics
Editable Spreadsheets
Manual Optimization
RSI 1D+Intraday Pro Pack
$139.00
28 Spreadsheets
1D+Intraday
18 Performance Metrics
Editable Spreadsheets
Automatic Optimization
Frequently Asked Questions
Find answers to common questions about our backtesting spreadsheets and how to use them.
What do I need to use these backtesting spreadsheets?
You only need Microsoft Excel (version 2021 or newer) and historical price data for the instrument you want to test.
How do I get the historical price data?
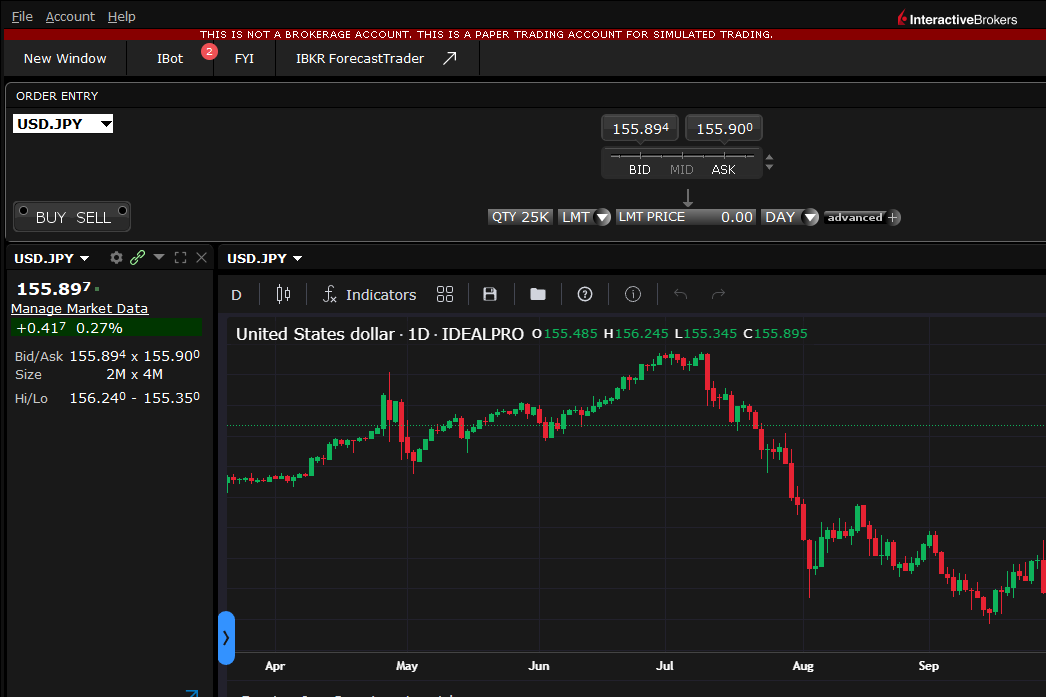
You can download historical price data from most trading platforms or financial websites. Investing.com or Yahoo Finance provide free historical price data in 1D time frame for various instruments. For intraday historical price data, consider using FirstRate Data or EODHD APIs.
How good should my knowledge of Excel be?
Basic knowledge is sufficient, such as understanding how to copy and paste data into a spreadsheet and edit cells. Our spreadsheets have a user-friendly interface with lots of prompts for users of any level.
What types of instruments can be used with these spreadsheets?
You can use these spreadsheets for any instrument for which historical data is available. This includes stocks, ETFs, indices, forex, commodities, and cryptocurrencies.
What are the hardware requirements?
A PC or laptop is required as Microsoft Excel provides all the necessary features only for these versions. The minimal system requirements are Windows 11 or Windows 10 for PC, Mac OS for Mac, and 4GB RAM, but for optimal performance, 8GB RAM or more is recommended, along with a modern processor.
How long does the optimization take?
A PC or laptop with a modern processor and 16GB RAM typically processes the optimization of 1000 indicator parameter combinations using 20,000 historical price data points in about 2 hours. Older computers may take more time, but modern computers with more RAM can complete the task in less time.
Can I edit these spreadsheets?
Yes, all our backtesting spreadsheets are fully editable and transparent. If you are an experienced Excel user, you can create your own backtesting spreadsheet with your unique strategy using our spreadsheets as a template.
Latest Articles
Stay updated with our latest articles and expert insights on trading strategies and market trends.
-

The Bollinger %b Indicator: A Trader’s Secret Weapon
–
Discover how Bollinger %b indicator reveals market emotion and trader behavior. Learn how to calculate it in Excel, use it in real strategies, and backtest it.
-

How to Backtest Breakout Trading Strategy in Excel
–
Explore what breakout trading strategy is, how it works, how you can master it step by step and how to backtest breakout strategy with Excel.
-

5 Strong Reasons to Use Paper Trading After Backtesting
–
5 compelling reasons why paper trading is a smart next step after backtesting. Plus, we’ll cover some free paper trading websites to help you get started.


